3 US Stocks With Strong Balance Sheets if Treasury Yields Stay Higher
DNOW Inc. DNOW | 0.00 |
Markets are focused on headlines about Japan potentially selling large amounts of US Treasuries to support the yen, and that kind of move can ripple through bonds, borrowing costs, and equity valuations. For stock pickers, the key question is which companies might be better placed if Treasury yields stay under pressure and volatility stays elevated. This is where the US Dollar Beneficiaries screener comes in, highlighting businesses with multinational reach and steadier profiles. In this article, you will see 3 stocks from that list that may be positively exposed to this backdrop.
Argan (AGX)
Overview: Argan is a US engineering and construction company that builds and maintains large power plants and industrial facilities, and also installs communication and power networks in the US, the Republic of Ireland, and the United Kingdom. Through its Power, Industrial, and Teledata segments, Argan provides end to end services from project design and equipment installation to ongoing maintenance and technical consulting.
Operations: Argan generates most of its revenue from its Power segment at about US$822.8 million, followed by Industrial at US$196.7 million and Teledata at US$22.4 million, with roughly US$925.0 million coming from the United States and the rest from the United Kingdom and Republic of Ireland.
Market Cap: US$11.2b
Argan stands out in this US dollar beneficiary theme because it combines a large backlog of power and infrastructure projects with a balance sheet that has been described as strong and free of debt, while also sourcing materials globally, which can help when the dollar is firm and import costs are easier to manage. Earnings growth has been described as strong, margins and return on equity are high, and recent index inclusion has increased visibility. At the same time, the stock trades on a very rich P/E and there has been significant insider selling. The business is also heavily tied to gas fired power projects, so investors need to weigh that concentration risk against the potential upside from AI driven power demand and a busy construction pipeline.
Argan’s rich P/E, strong balance sheet and heavy gas fired exposure hint at a story investors may be only half reading. Get the full picture with the 2 key rewards and 1 important warning sign
The price-to-earnings (P/E) ratio is one tool investors use to evaluate whether a stock’s current valuation appears high, low, or roughly in line with peers. It is calculated by dividing a company’s current share price by its earnings per share. When looking at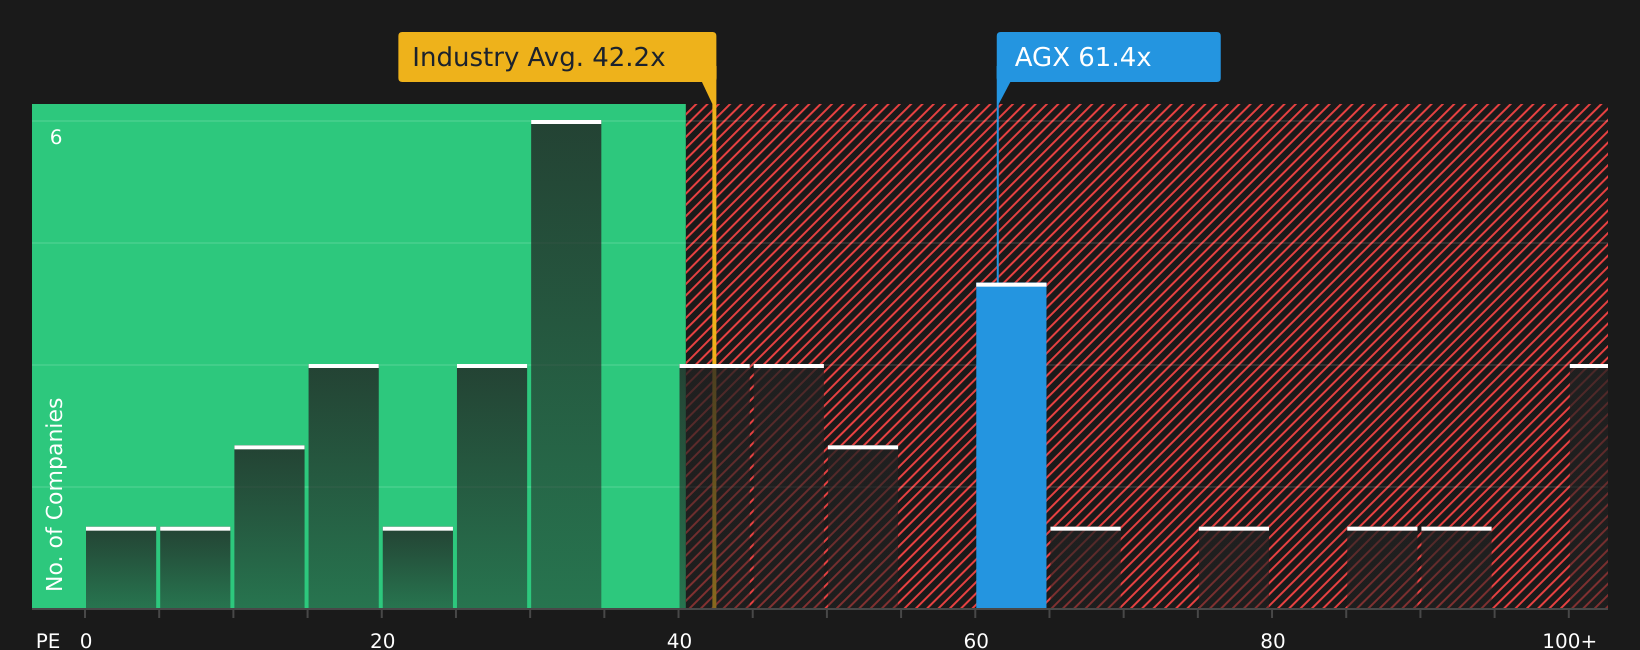
Preformed Line Products (PLPC)
Overview: Preformed Line Products is a US based manufacturer that supplies hardware, connectors, fiber optic solutions, closures, and related equipment that keep power grids, telecom networks, and other critical infrastructure running in the US and across international markets. Its products support utilities, communication companies, contractors, and distributors across overhead, ground mounted, and underground networks, including solar and EV charging applications.
Operations: Preformed Line Products generates about US$697.1 million in revenue from wire and cable related products, with around US$340.1 million from PLP USA and the balance spread across Asia Pacific, the Americas, and Europe, Middle East & Africa, including intersegment sales.
Market Cap: US$2.0b
Preformed Line Products fits into the US Dollar Beneficiaries theme as a global infrastructure supplier with a large US footprint, where a strong dollar can help on input costs while limiting foreign exchange drag on reported results. Earnings are forecast to grow about 21% a year, yet profit margins have slipped to 4.9% and return on equity is only 7.2%, so investors are paying for growth that still has to translate into stronger profitability. The stock trades on a very high P/E multiple and above estimated future cash flow value, and there was an US$11.7 million non recurring loss in the last 12 months, so understanding how much of recent performance is repeatable can be important for investors weighing this opportunity against the risks.
Preformed Line Products sits at the intersection of growth expectations and thin margins, and the real story lies in how those factors compare with its valuation. Get the full context in the 1 key reward and 1 important warning sign

DNOW (DNOW)
Overview: DNOW is a Houston based distributor that supplies pipe, valves, fittings, pumps, safety gear, and related equipment, along with supply chain services, to energy, utilities, and a wide range of industrial customers worldwide. It supports everything from upstream and midstream oil and gas operations to refineries, chemical plants, data centers, water treatment facilities, and renewable natural gas projects.
Operations: DNOW generates about US$3.4b in revenue from wholesale distribution, with roughly US$2.8b from the United States, US$203m from Canada, and US$396m from other international markets.
Market Cap: US$2.4b
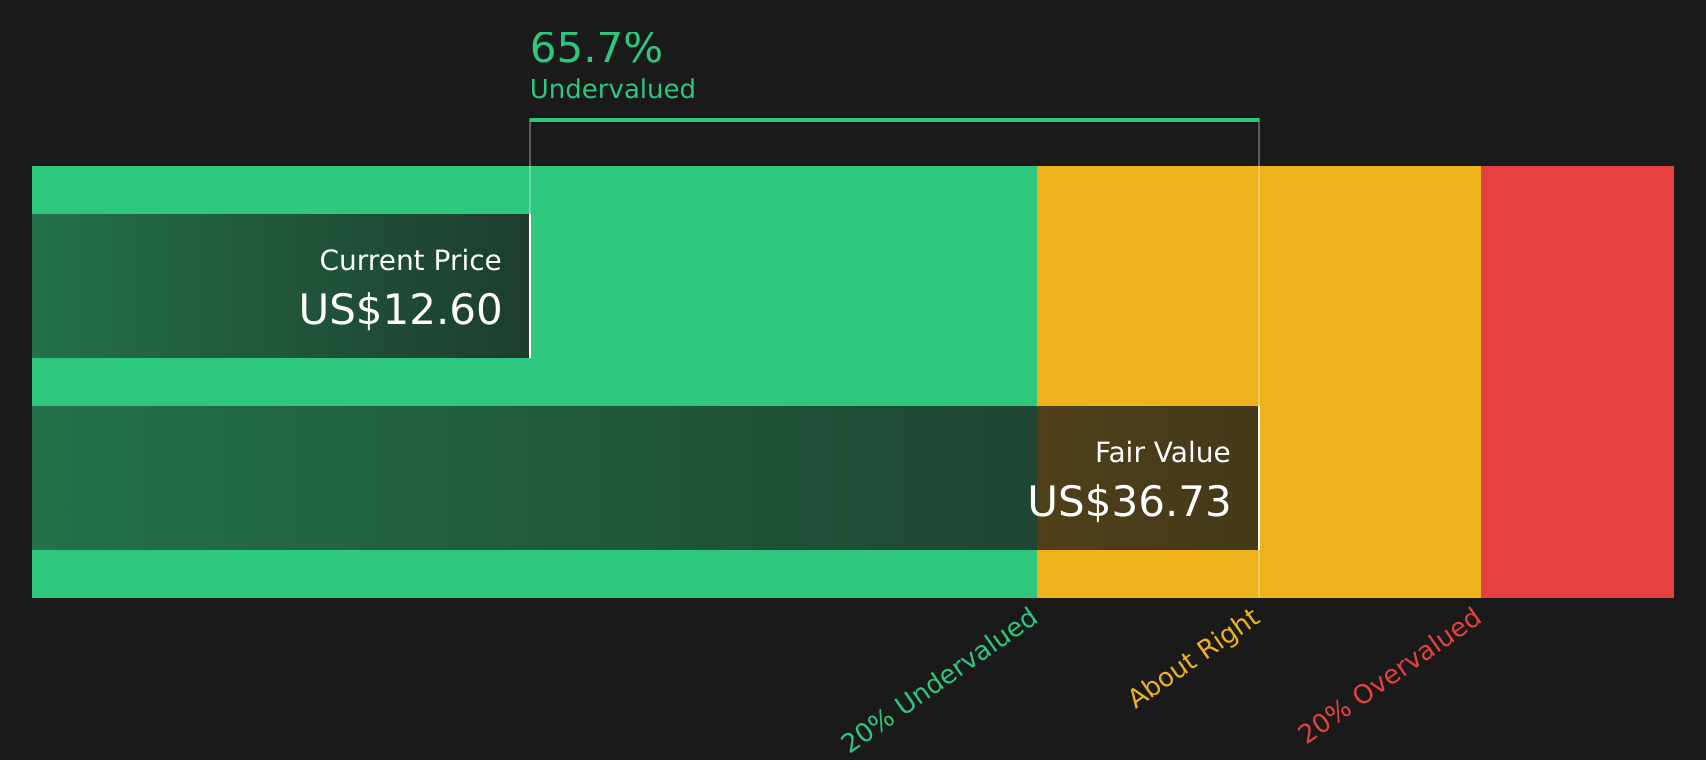
DNOW sits at the crossroads of energy, infrastructure, and industrial spending. That mix becomes more interesting when the US dollar is strong and the company is importing heavily while most of its cost base and customers are domestic. The recent MRC Global acquisition, expanding midstream exposure and energy evolution projects, plus investment in digital tools aim to build a broader, more efficient platform. However, the company is still loss making and integration risk is real after Q1 2026 losses and operational disruption. DNOW is trading well below some fair value estimates, and the story hinges on whether management can turn higher revenue, cost synergies, and buybacks into durable profitability in a volatile rate and currency backdrop.
DNOW’s valuation debate hinges on whether its loss-making profile and integration risk are obscuring a stronger core business, and the analysis report for DNOW could surface the one factor that changes the narrative.
If these three stocks caught your attention, they are only the starting point. The full US Dollar Beneficiaries screener highlights 9 more companies that share similar US dollar beneficiary traits and equally compelling narratives. Use Simply Wall St to identify and analyze the specific catalysts, balance sheet strengths, and multinational setups that fit your highest conviction ideas within this theme.
Take Control of Your Investment Journey
If DNOW or any of these companies sound like a great opportunity, register for FREE with Simply Wall St and add your companies to a Watchlist to monitor the share price against the fair value the ideal entry point. Once you've made your move, manage your holdings with our Portfolio Command Center that filters out the noise to deliver only the most critical, actionable updates. Throughout your journey, our Community allows you to filter the best ideas from thousands of investor perspectives. By uncovering hidden catalysts and risks early, you'll accelerate your decision-making and stay one step ahead of the market.
Seeking Fresh Alternatives Beyond These Ideas?
New themes can gain momentum quickly, and attractive entry points often appear before most investors are watching. Tap into fresh, under the radar stock lists while it matters and consider acting promptly.
- Identify resilient cash generators before they start breaking out by scanning the 41 high quality undervalued stocks built to highlight strong balance sheets and healthy cash flows.
- Explore long term infrastructure trends by filtering companies involved in the grid upgrade cycle using the curated 35 power grid technology and infrastructure stocks focused on transmission, hardware, and supporting technology.
- Follow the AI build out by tracking suppliers and enablers with the focused 53 AI infrastructure stocks that concentrates on critical capacity and supporting equipment.
This article by Simply Wall St is general in nature. We provide commentary based on historical data and analyst forecasts only using an unbiased methodology and our articles are not intended to be financial advice. It does not constitute a recommendation to buy or sell any stock, and does not take account of your objectives, or your financial situation. We aim to bring you long-term focused analysis driven by fundamental data. Note that our analysis may not factor in the latest price-sensitive company announcements or qualitative material. Simply Wall St has no position in any stocks mentioned.