

3 Value Stocks With Low P E Ratios And Dividend Yields Above 2%
TRUIST FINANCIAL CORPORATION TFC | 0.00 |
With the S&P 500 priced at one of its richest Shiller P/E readings on record and dividend yields near historic lows, many investors are wondering where to find solid value without simply hugging the index. This is where a focus on larger companies with lower P/E ratios and dividend yields above 2% can feel especially relevant. This article walks through three stocks that stand out on those measures and appear particularly exposed to the current valuation extremes in the market.
The stocks highlighted below are only a small sample of what fits this value-oriented lens, and the full screen surfaced 15 more larger companies with relatively low P/E ratios, solid balance sheets, and dividend yields above 2% that also carry compelling narratives. If you want to go straight to the source and identify your highest conviction value ideas, head into the Value Stocks screener.
Popular (BPOP)
Overview: Popular is a long established Puerto Rico based bank that provides a broad mix of retail, commercial, and mortgage banking services, along with credit cards, insurance, wealth management, and digital banking across Puerto Rico, the mainland United States, the British Virgin Islands, the Caribbean, and Latin America.
Market Cap: US$11.1b
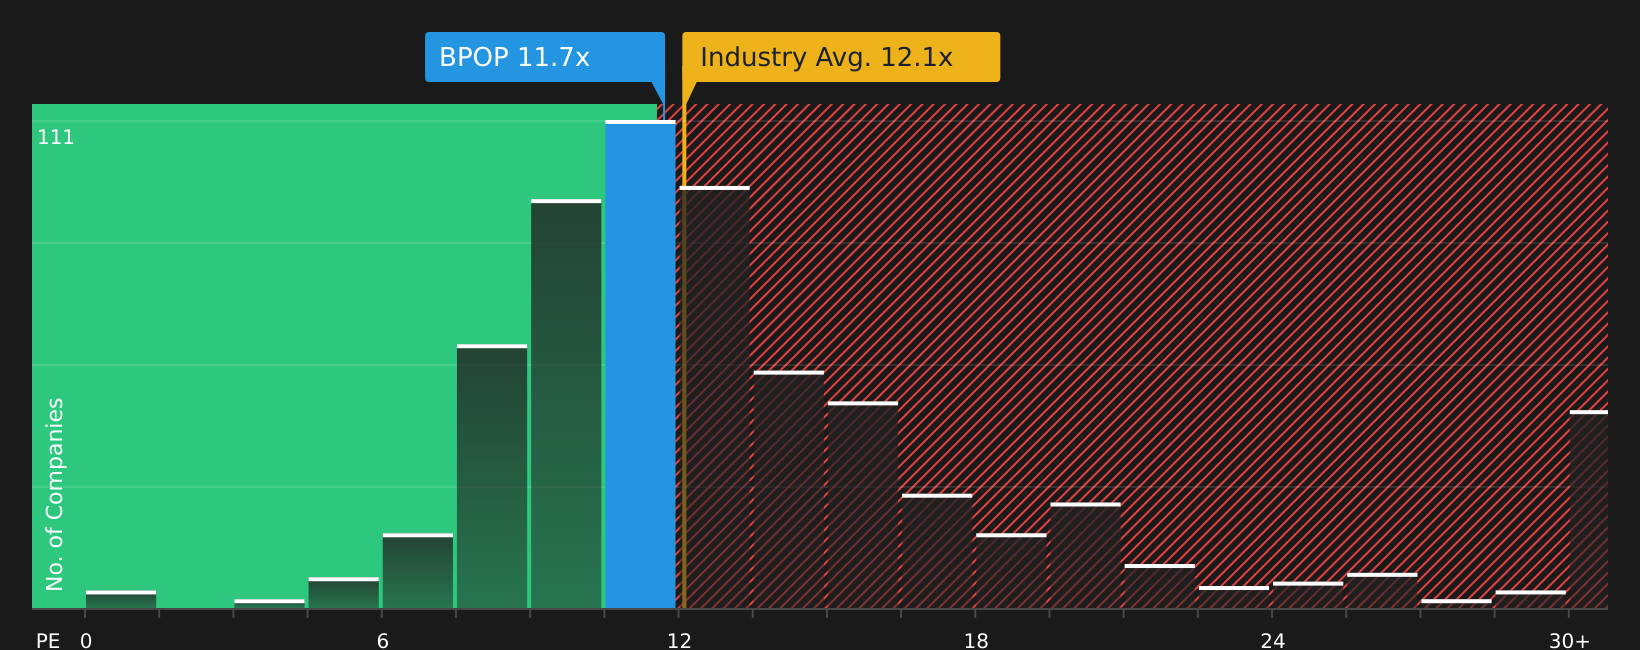
Popular stands out today because it combines a relatively low P/E multiple and a dividend yield above 2% with solid recent execution on earnings, net interest income and capital returns, while the wider S&P 500 trades on very rich valuations and record low yields. The bank is returning significant capital through a 20% dividend increase to US$0.90 per share and up to US$1b in buybacks, supported by strong capital ratios and Q2 2026 earnings that beat expectations. At the same time, investors need to weigh real risks around heavy exposure to Puerto Rico, rising competition for deposits and recent insider selling. For value focused investors, that mix of income, buybacks and concentrated regional risk makes Popular worth a closer look.
Popular’s mix of income, buybacks and regional concentration has many investors only seeing half the picture. To get a fuller view beyond the headline P/E and dividend story, review the 5 key rewards and 1 important warning sign
Build your own income and value shortlist around Popular
Popular and the other two stocks in this article all came out of a simple screen that combined valuation, dividends, and balance sheet quality. Use our flexible Screener to set filters that fit your style, or start with any of our curated Investing Ideas for ready made stock shortlists.
F.N.B (FNB)
Overview: F.N.B. Corporation is a Pittsburgh based bank and financial holding company that serves consumers, businesses, and government clients across the Mid Atlantic and Southeast through community banking branches, digital and mobile banking, wealth management, and a broad range of insurance products.
Operations: F.N.B. generates almost all of its US$1.7b in annual revenue from Community Banking at about US$1.7b, with additional contributions from Wealth Management at US$85 million and Insurance at US$21 million in the United States.
Market Cap: US$6.7b
Investors looking for value outside the stretched S&P 500 might find F.N.B interesting because it couples a relatively low P/E with a 2.74% dividend yield, while still posting record Q2 2026 revenue of about US$463 million and healthy credit trends. The bank is leaning into digital channels and diversified fee income in areas like wealth and treasury services, which can support earnings consistency even as net interest income guidance has been trimmed due to tougher deposit competition. At the same time, regional concentration, commercial real estate exposure, and recent insider selling mean the story is not risk free. For investors who want income, measured growth, and a classic mid cap bank value profile, F.N.B is worth closer attention.
F.N.B’s mix of community banking scale, digital channels and a 2.74% yield may be masking a very different risk reward profile than the headline P/E suggests. Walk through the full story in the 5 key rewards and 1 important warning sign

Truist Financial (TFC)
Overview: Truist Financial is a large Charlotte based bank that serves consumers and businesses across the Southeast and Mid Atlantic with a full range of deposit accounts, lending, wealth management, capital markets, insurance and digital banking services through its Consumer and Small Business Banking and Wholesale Banking segments.
Operations: Truist Financial generates about US$10.8b in revenue from Wholesale Banking and US$10.7b from Consumer and Small Business Banking, partly offset by a US$2.5b loss in Other, Treasury & Corporate, with all of its reported US$19.0b in revenue coming from the United States.
Market Cap: US$63.95b
Truist Financial is notable for value oriented investors because it combines a long operating history and broad regional footprint with a relatively low P/E, a 4.01% dividend yield and earnings quality that some investors may view as attractive, at a time when the S&P 500’s valuations and dividend yield may appear less compelling to some market participants. Recent recognition as best in class in online and mobile banking, particularly for small businesses, indicates its digital investment is contributing to higher engagement and potential cost efficiency. At the same time, leadership transitions and insider selling may give some investors reasons to be cautious. Together with sizeable commercial real estate exposure and a large branch network, Truist Financial is a bank that some investors may consider for a long term focus, but it clearly warrants careful research and analysis first.
Truist Financial’s low P/E and 4.01% yield could be masking a very different story around earnings quality and regional exposure. Get the context behind the headlines in the analysis report for Truist Financial

Seeking Alternatives Before The Crowd Moves
Fresh opportunities do not stay quiet for long. Stocks can be breaking out, momentum can be flying, or quality can be dropping under the radar for now. Act now and get in early.
- Spot income workhorses before yield hunters pile in by reviewing the hand picked 9 dividend fortresses, while payout strength and balance sheet quality still matter most.
- Catch early movers in automation and manufacturing efficiency by scanning the curated 37 robotics and automation stocks before industrial demand shifts and the crowd gets caught chasing.
- Ride the backbone of digital finance by checking the focused 20 cryptocurrency and blockchain stocks while these infrastructure plays are still flying mostly under the radar.
This article by Simply Wall St is general in nature. We provide commentary based on historical data and analyst forecasts only using an unbiased methodology and our articles are not intended to be financial advice. It does not constitute a recommendation to buy or sell any stock, and does not take account of your objectives, or your financial situation. We aim to bring you long-term focused analysis driven by fundamental data. Note that our analysis may not factor in the latest price-sensitive company announcements or qualitative material. Simply Wall St has no position in any stocks mentioned.