

$797 Billion Left Big Tech Last Week. Where Did It Go? Here's One Way Investors Are Diversifying
PHLX Semiconductor SOX | 0.00 | |
VanEck Vectors Semiconductor ETF SMH | 0.00 | |
S&P 500 index SPX | 0.00 | |
Spdr Select Sector Fund - Consumer Staples XLP | 0.00 | |
Healthcare Select Sector SPDR XLV | 0.00 |
What Happened: AI and Chip Stocks Sold Off, but the Broader Market Held Up
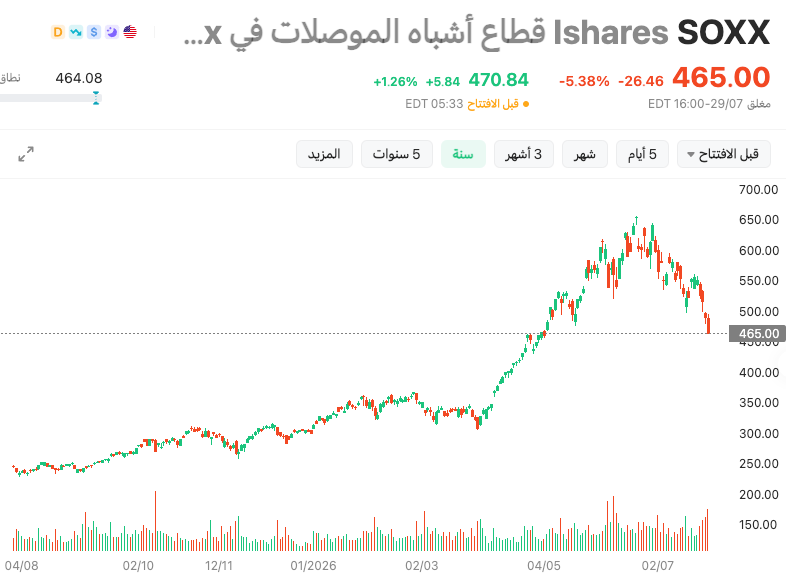
Over the past several weeks, shares of artificial-intelligence and semiconductor companies have taken a sharp hit. The Philadelphia Semiconductor Index (PHLX Sox Semiconductor Sector Ishares(SOXX.US))—a basket of the largest chip makers—sat roughly 28% below its late-June peak by late July 2026, and the VanEck Vectors Semiconductor ETF(SMH.US) slipped about 25% from its own 52-week high during the same stretch.
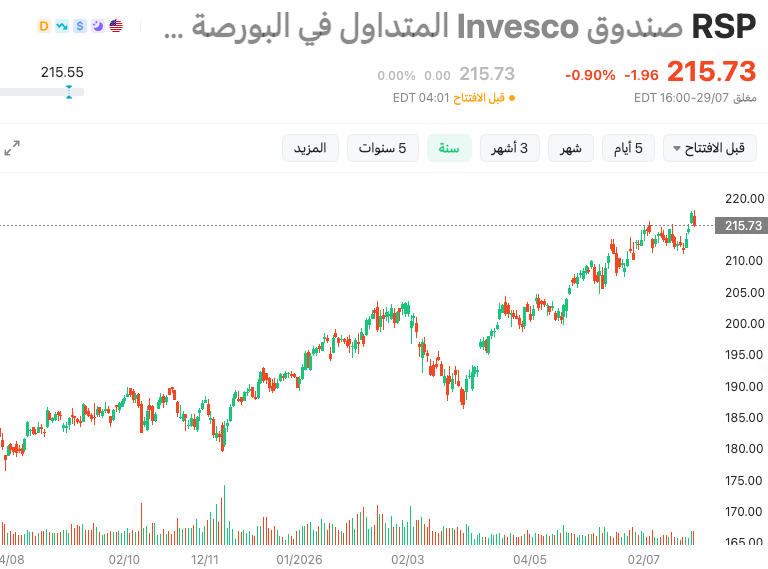
Yet major U.S. stock indices flinched less. The S&P 500 index(SPX.US) dipped less than 5% from its June peak. And the equal-weighted version of the S&P 500 (Invesco Exchange Traded Fd Tr S&P 500 Equal Weight ETF(RSP.US))—which gives every stock the same influence regardless of size—reached an all-time-high on Tuesday, 28 July.
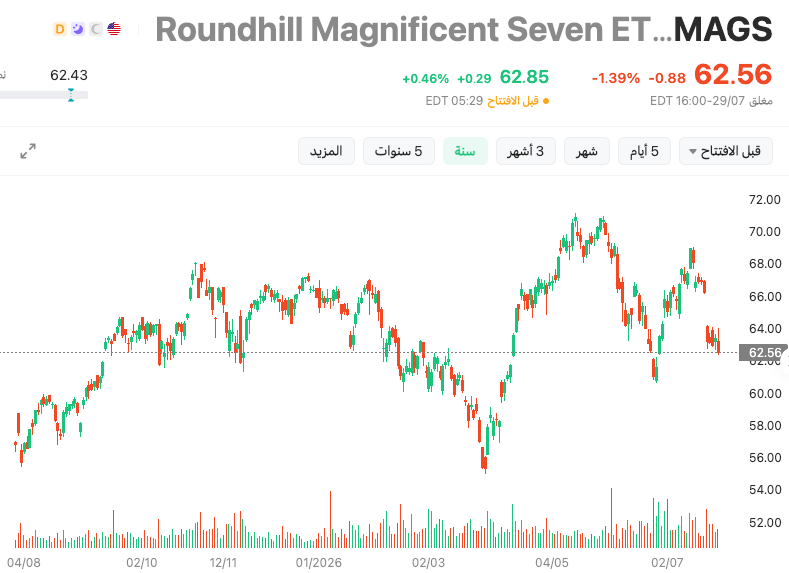
Meanwhile, a widely followed group of mega-cap tech names collectively known as the "Magnificent Seven" (Roundhill Magnificent Seven ETF(MAGS.US)) fell more than 11% from their June highs. Bloomberg reported that "The Magnificent Seven technology behemoths suffered their biggest one-day drop since the tariff tantrum in April 2025 on Thursday (23 July), with an index of the group falling 4.8% and wiping out $797 billion in market value." The gap between those losses and the rest of the market's resilience illustrates a pattern called sector rotation—money flowing out of one corner of the market and into others.
Why This Matters: Owning Five Tech Stocks Is Not the Same as Being Diversified
Diversification—spreading your money across different types of investments—is one of the oldest ideas in investing. But it only works if those investments actually respond to different forces.
Imagine a portfolio holding a chip maker, a cloud-computing company, an AI software firm, a server manufacturer, and an electric-vehicle stock. Five companies, five different products—but all of them can be dragged down at once if investors start questioning how much corporations will spend on AI infrastructure, or if long-term interest rates rise and make high-growth valuations look less attractive.
That is essentially what happened in mid-2026. When the market began reassessing the pace at which AI spending would translate into actual earnings, nearly every stock tied to that story came under pressure at the same time.
Genuine diversification means holding assets whose earnings come from meaningfully different sources—different industries, different customer bases, different economic sensitivities.
The Building Blocks: S&P 500 Sectors and How Sector ETFs Work
Under a global classification system called GICS (Global Industry Classification Standard), every company in the S&P 500 falls into one of 11 broad sectors: Information Technology, Financials, Health Care, Industrials, Consumer Discretionary, Consumer Staples, Energy, Utilities, Real Estate, Materials, and Communication Services.
State Street's SPDR Select Sector ETF lineup carves the S&P 500 into funds that each track one of those 11 sectors. Together, these 11 funds cover every single stock in the S&P 500—so think of them as slicing the same pie into different pieces.
A broad-market ETF (like one tracking the full S&P 500) gives you a bit of everything. A sector ETF lets you tilt more toward a specific slice. One common approach: hold a broad-market fund as the core of your portfolio, then use one or two sector ETFs to adjust its character—adding more defensive exposure, or leaning into a cyclical theme—without replacing the core.
Four Non-Tech Sector ETFs in Focus
The following four SPDR sector ETFs have drawn attention during the recent rotation away from tech. Each one taps into a different part of the economy.
1. XLP — Consumer Staples: The "People Still Need Toothpaste" Sector
The Spdr Select Sector Fund - Consumer Staples(XLP.US) holds S&P 500 companies that sell everyday essentials—food, beverages, household cleaners, personal-care products, tobacco. Its top holdings include names like Walmart, Costco, Procter & Gamble, and Coca-Cola (as of June 30, 2026, per the fund's official factsheet).
The logic is straightforward: a consumer might delay buying a new laptop, but toothpaste, groceries, and laundry detergent are hard to skip. That relatively predictable demand tends to make earnings in this sector more stable and easier to forecast than earnings in tech.
However, "essential" does not mean "bullet-proof." If input costs (raw materials, labor, shipping) rise faster than these companies can raise prices, margins get squeezed. And if valuations get stretched, the sector can still sell off.
According to the fund's official factsheet (as of June 30, 2026), XLP's NAV delivered a 10-year annualized return of approximately 7.02%.
2. XLV — Health Care: Demand That Doesn't Track the Nasdaq
The Healthcare Select Sector SPDR(XLV.US) covers pharmaceuticals, biotech, medical devices, health-care services, and life-sciences tools. Top holdings include Eli Lilly, Johnson & Johnson, AbbVie, and UnitedHealth Group (as of June 30, 2026, per the fund's official factsheet).
Health care's appeal during a tech sell-off is that its revenue drivers are largely independent of corporate technology budgets. People do not stop filling prescriptions or scheduling surgeries because the Nasdaq fell. On top of that defensive quality, the sector also carries growth catalysts: aging populations worldwide, new drug pipelines, and advances in medical technology.
The risks are real, too. Government drug-pricing reforms, regulatory crackdowns, clinical-trial failures, and patent expirations can all hit individual holdings hard.
According to the fund's official factsheet (as of June 30, 2026), XLV's NAV delivered a 10-year annualized return of approximately 10.09%.
3. XLU — Utilities: Steady Cash Flows, but Watch Interest Rates
The Spdr Select Sector Fund - Utilities(XLU.US) invests in S&P 500 electric, gas, and water utility companies. Top holdings include NextEra Energy, Southern Company, and Duke Energy (as of June 30, 2026, per the fund's official factsheet).
Utilities are a textbook defensive sector. People pay their electricity and water bills in good times and bad, so revenues tend to be predictable. Many utility stocks also distribute relatively consistent dividends, which appeals to investors who prioritize regular cash income.
The catch: utilities are heavy borrowers—they need capital to build and maintain power grids, plants, and pipelines. When bond yields rise, their borrowing costs climb, and their dividends look less attractive compared with risk-free Treasury yields. So while utilities are "defensive" in the sense that their business is stable, their stock prices can still be sensitive to interest-rate movements.
According to the fund's official factsheet (as of June 30, 2026), XLU's NAV delivered a 10-year annualized return of approximately 9.00%.
4. XLE — Energy: Strong Recently, but Not a Pure Safety Play
The Spdr Select Fund-Energy Select Sector(XLE.US) holds S&P 500 oil, natural gas, and energy-equipment companies. Exxon Mobil alone accounts for about 20% of the fund, followed by Chevron at roughly 14% (as of June 30, 2026, per the fund's official factsheet).
Energy behaves very differently from the three sectors above. Rather than offering stability through predictable demand, energy stocks are closely tied to commodity prices, supply dynamics, and geopolitical developments. When oil prices jump—due to supply cuts, conflicts, or inflation fears—energy earnings can surge. When crude prices collapse or global demand weakens, the sector can drop sharply.
That volatility showed up clearly in recent data: for the second quarter of 2026 alone, XLE's NAV return was approximately −12.55%, even though the fund's 10-year annualized NAV return stood at roughly 8.82% as of June 30, 2026 (both figures per the fund's official factsheet). In short, energy can offer portfolio exposure to a completely different set of price drivers than tech, but calling it "safe" would be misleading.
Quick-Reference Comparison
| Feature | Spdr Select Sector Fund - Consumer Staples(XLP.US) (Staples) | Healthcare Select Sector SPDR(XLV.US) (Health Care) | Spdr Select Sector Fund - Utilities(XLU.US) (Utilities) | Spdr Select Fund-Energy Select Sector(XLE.US) (Energy) |
|---|---|---|---|---|
| 10-Yr Ann. NAV Return* | 7.02% | 10.09% | 9.00% | 8.82% |
| Q2 2026 NAV Return* | +2.09% | +8.74% | +0.56% | −12.55% |
| Expense Ratio | 0.08% | 0.08% | 0.08% | 0.08% |
| # of Holdings | 34 | 60 | 31 | 21 |
| 30-Day SEC Yield | 2.63% | 1.59% | 2.67% | 2.84% |
| Portfolio Role | Defensive | Defensive + growth | Defensive / income | Cyclical / commodity |
| Key Risk | Input-cost pressure, low growth ceiling | Drug-pricing policy, trial failures | Rising interest rates | Oil-price swings, geopolitical shifts |
* All performance figures are from the funds' official SSGA factsheets as of June 30, 2026. Past performance does not guarantee future results. The table is sorted by 10-year return (highest first) for easy comparison; this ordering does not imply a ranking or recommendation.
Before You Rotate: Three Questions Worth Asking
Watching tech fall and rushing entirely into whichever sector is up this month can easily become just another form of chasing recent performance. Rather than swapping one concentrated bet for another, it may be worth pausing to consider:
First, whether your existing holdings are heavily concentrated in a single theme. If nearly every stock you own rises or falls based on AI spending expectations, you may be more exposed to one risk factor than you realize.
Second, what role you want the new exposure to play. Are you looking for something that tends to hold up when markets wobble (defensive), something with long-term growth characteristics independent of tech, or something tied to commodities and inflation?
Third, whether you can tolerate the specific downsides of that sector. Utilities can lag badly when rates rise; energy can swing sharply with oil prices; health care can be hit by regulatory headlines. Every sector carries its own set of risks.
A starting framework that many investors use: let a broad-market ETF handle the heavy lifting of capturing overall market growth, and layer in one or two sector ETFs only to fine-tune the portfolio's risk profile—not to chase whichever sector had the best month.
The Bigger Picture
The recent divergence between tech and the rest of the market does not necessarily mean the long-term case for technology has broken. What it does show is that capital moves between sectors constantly, and if your entire portfolio is anchored to a single narrative, a shift in that narrative can hit every position at once.
Sector leadership rotates. Making sure your portfolio can weather those rotations—rather than trying to predict which sector tops the chart next quarter—is a more durable approach to managing risk over time.
This article is for informational and educational purposes only and does not constitute investment advice, a personal recommendation, or an offer to buy or sell any security. All investment involves risk, including possible loss of principal. Past performance is not indicative of future results. Readers should consult a qualified financial advisor before making any investment decisions.