A Closer Look At Apollo Global Management (APO) Valuation After Recent Share Price Moves
Apollo Global Management Inc APO | 107.05 | +1.60% |
Recent performance snapshot
Apollo Global Management (APO) has drawn fresh attention after a recent move in its share price, with the stock last closing at $111.42 and showing mixed returns across different time frames.
The recent 1 month share price return of 6.52% stands against a 90 day share price decline of 23.03%, while the 5 year total shareholder return of 159.11% points to a much stronger longer term record. This suggests that momentum has faded in the shorter term as investors reassess growth prospects and risk.
If you are comparing Apollo with other opportunities in fast changing areas of the market, this could be a good moment to scan 20 top founder-led companies
With APO trading at $111.42, alongside a 40% intrinsic discount measure and a sizeable gap to analyst targets, the key question now is simple: is this a genuine value opportunity, or is any future growth already fully priced in?
Price to earnings of 18.4x: Is it justified?
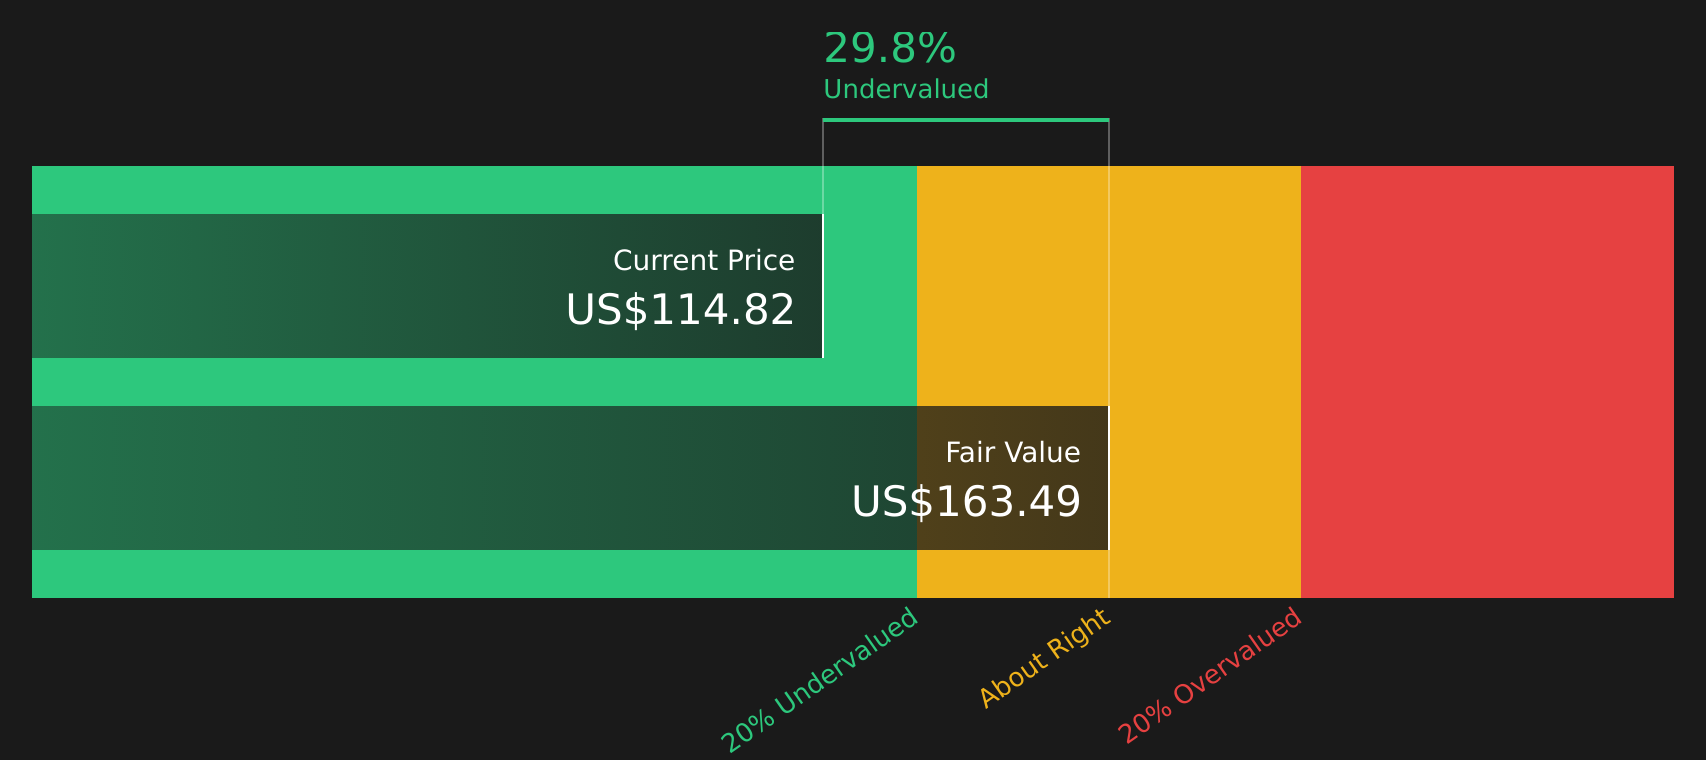
On a P/E of 18.4x at a last close of $111.42, Apollo Global Management currently trades at a higher earnings multiple than both its industry and peer group, even though the SWS DCF model indicates a 40.4% intrinsic discount to an estimated future cash flow value of $187.06.
The P/E ratio compares the current share price to earnings per share and is a quick way to see how much investors are paying for each dollar of earnings. For a diversified financial group like Apollo, which earns fees from asset management and returns from principal investments and retirement services, the P/E can reflect how the market is weighing the quality, stability and expected path of those earnings.
Here, the signals are mixed. On one hand, Apollo is described as having high quality earnings and earnings have grown strongly over the past 5 years, with forecasts pointing to annual profit growth of around 23.9% and earnings expected to grow significantly over the next 3 years. On the other hand, profit margins have compressed from 17.9% to 11%, earnings contracted by 24.4% over the past year and return on equity of 12.7% is tagged as low, with forecasts suggesting ROE of 18.7% in three years that is still framed as low by the model. This combination points to the market paying a premium multiple that bakes in solid profit growth expectations while looking through the recent margin and earnings setback. At the same time, the fair P/E estimate of 22.3x from the SWS fair ratio model sits well above the current 18.4x, which suggests the multiple could have room to move closer to that fair level if those earnings growth forecasts play out and quality is maintained.
Compared with the US diversified financials industry average P/E of 15.4x and a peer average of 13.6x, Apollo screens as expensive on a simple relative basis. The gap is not marginal; it is a clear premium that relies on the market continuing to pay up for the earnings profile described above and for the business mix outlined in its asset management, principal investing and retirement services segments, especially given the model flagged that revenue is expected to decline sharply over the next 3 years.
Result: Price-to-earnings of 18.4x (OVERVALUED).
However, a sharp 89% annual revenue decline and model expectations of a steep revenue drop over the next three years could challenge the high P/E premium.
Another view from cash flows
While the P/E of 18.4x makes Apollo Global Management look expensive against its industry and peers, the SWS DCF model points in the opposite direction, with an estimated future cash flow value of $187.06 per share versus the current $111.42 price, implying 40.4% undervaluation. Which signal do you weigh more heavily: the market’s P/E multiple or the DCF-based valuation?
Simply Wall St performs a discounted cash flow (DCF) on every stock in the world every day (check out Apollo Global Management for example). We show the entire calculation in full. You can track the result in your watchlist or portfolio and be alerted when this changes, or use our stock screener to discover 58 high quality undervalued stocks. If you save a screener we even alert you when new companies match - so you never miss a potential opportunity.
Next Steps
With sentiment clearly split between upside potential and real concerns, this is a good time to check the underlying data yourself and move quickly to shape your own view. You can start with 3 key rewards and 2 important warning signs
Looking for more investment ideas?
If Apollo has your attention, do not stop here. Use this momentum to scan broader opportunities so you are not missing better risk reward setups elsewhere.
- Target potential mispricings by reviewing companies that screen well on quality and valuation through the 58 high quality undervalued stocks.
- Prioritise resilience by checking stocks that rate strongly on financial strength using the solid balance sheet and fundamentals stocks screener (39 results).
- Hunt for underfollowed opportunities by scanning the screener containing 25 high quality undiscovered gems before other investors catch on.
This article by Simply Wall St is general in nature. We provide commentary based on historical data and analyst forecasts only using an unbiased methodology and our articles are not intended to be financial advice. It does not constitute a recommendation to buy or sell any stock, and does not take account of your objectives, or your financial situation. We aim to bring you long-term focused analysis driven by fundamental data. Note that our analysis may not factor in the latest price-sensitive company announcements or qualitative material. Simply Wall St has no position in any stocks mentioned.