A Look At Amkor Technology (AMKR) Valuation After Recent Share Price Swings
Amkor Technology, Inc. AMKR | 59.72 | -2.61% |
Amkor Technology (AMKR) has attracted investors’ attention after recent share price swings, with the stock showing a mix of short term pullbacks and stronger performance over the past 3 months and year.
The latest 1 day share price return of 8.15% sits against a 7 day share price return of 16.53% and a 90 day share price return of 62.85%, while the 1 year total shareholder return of 135.8% points to strong longer term momentum building from a much lower base.
If Amkor’s swingy moves have you looking beyond a single name, this could be a good moment to see what else is setting up in 34 AI infrastructure stocks as another potential source of ideas.
With Amkor now at US$51.59, a value score of 3 and trading only about 9% below the average analyst price target, the key question is whether the recent gains leave more room for upside, or if the market is already pricing in future growth?
Most Popular Narrative: 16.8% Undervalued
At a last close of $51.59 against a most followed fair value of $62.00, the leading narrative sees meaningful upside that rests heavily on advanced packaging demand and new capacity projects.
While analyst consensus expects efficiency gains from expanded U.S. and global capacity, these projections likely understate the absolute scale of Amkor's manufacturing lead. Rapid ramp-ups in regions like Vietnam and Arizona, paired with deepening ties to ecosystem leaders (including both top fabless and foundry partners), could make Amkor uniquely dominant in securing new design wins and contracts, driving multi-year outperformance in revenue and earnings growth.
Curious what kind of revenue pace and margin lift are baked into that view, and what future earnings multiple it assumes, the full narrative lays out a detailed playbook that joins growth, profitability and required return into one bold valuation case.
Result: Fair Value of $62 (UNDERVALUED)
However, this upbeat case still depends on big Arizona and Vietnam buildouts filling efficiently, as well as on a concentrated customer base not pulling back or shifting volume.
Another View: Cash Flows Paint A Tougher Picture
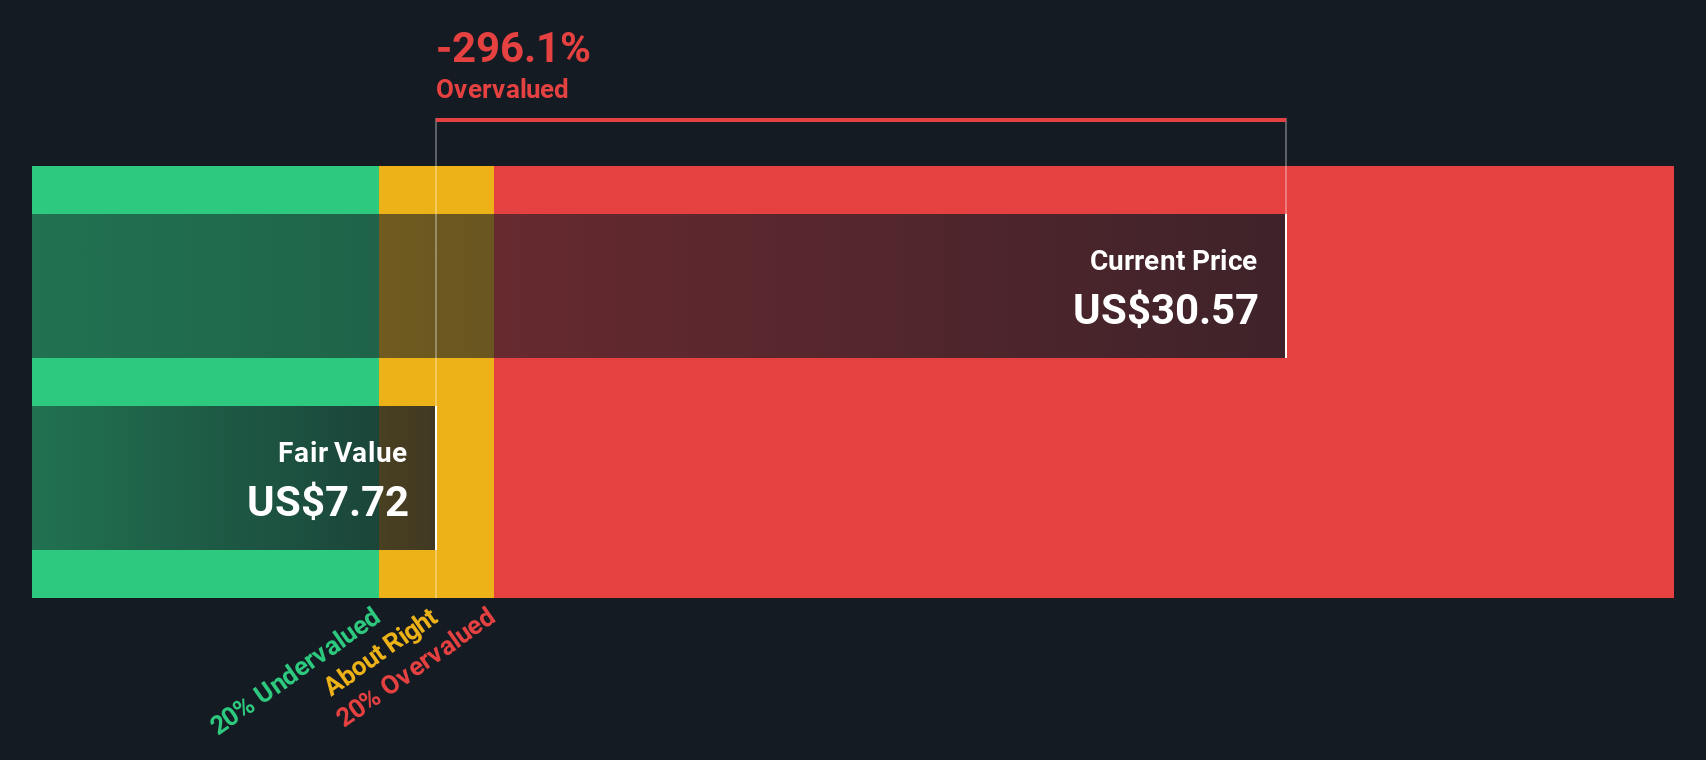
While the popular narrative points to a fair value of US$62 and labels Amkor undervalued, our DCF model points the other way. On that cash flow view, Amkor at US$51.59 sits above an estimated value of US$4.62, which flags a large valuation gap investors cannot ignore.
If you are weighing that kind of spread between price and cash flow value, it can help to see exactly how the numbers are built. Look into how the SWS DCF model arrives at its fair value.
Simply Wall St performs a discounted cash flow (DCF) on every stock in the world every day (check out Amkor Technology for example). We show the entire calculation in full. You can track the result in your watchlist or portfolio and be alerted when this changes, or use our stock screener to discover 55 high quality undervalued stocks. If you save a screener we even alert you when new companies match - so you never miss a potential opportunity.
Build Your Own Amkor Technology Narrative
If you see the data differently or prefer to rely on your own work, you can pull everything together and craft a custom view in just a few minutes. Do it your way
A great starting point for your Amkor Technology research is our analysis highlighting 4 key rewards and 1 important warning sign that could impact your investment decision.
Ready for more investment ideas?
If you stop with just one company, you risk missing out on other opportunities, so use the Simply Wall St Screener to line up your next candidates.
- Spot potential value opportunities early by scanning our 55 high quality undervalued stocks that combine quality fundamentals with prices that may not fully reflect them yet.
- Strengthen your income watchlist by zeroing in on 16 dividend fortresses that aim to pair higher yields with resilience.
- Lower the bumps in your portfolio by checking 85 resilient stocks with low risk scores that score well on stability factors many investors care about.
This article by Simply Wall St is general in nature. We provide commentary based on historical data and analyst forecasts only using an unbiased methodology and our articles are not intended to be financial advice. It does not constitute a recommendation to buy or sell any stock, and does not take account of your objectives, or your financial situation. We aim to bring you long-term focused analysis driven by fundamental data. Note that our analysis may not factor in the latest price-sensitive company announcements or qualitative material. Simply Wall St has no position in any stocks mentioned.