A Look At Apollo Global Management (APO) Valuation After Record Fee Earnings And US$1 Trillion AUM Milestone
Apollo Global Management Inc APO | 0.00 |
Apollo Global Management (APO) has drawn attention after reporting record fee related earnings and crossing US$1 trillion in assets under management in the first quarter of 2026, alongside higher dividends and reaffirmed guidance.
The latest results and US$1 trillion AUM milestone come after a mixed price pattern, with a 21.29% 1 month share price return but a 12.84% decline year to date and a 2.58% 1 year total shareholder return. Recent momentum is therefore picking up from a weaker base.
If Apollo’s recent moves have you thinking about where capital is flowing next, it could be a good moment to broaden your search and check out 18 top founder-led companies
So with Apollo reporting record fee related earnings and surpassing the US$1 trillion AUM mark, while the stock is still down year to date, is this an undervalued compounder in plain sight, or is the market already pricing in future growth?
Preferred P/E of 63.8x: Is it justified?
Apollo is trading on a P/E of 63.8x, which is well above several benchmarks while the last close sits at $127.79, so the market is clearly paying up for current earnings.
The P/E ratio compares the share price to earnings per share, and for a diversified financial company like Apollo it reflects what investors are willing to pay for each dollar of current earnings. A high P/E can sometimes signal confidence that earnings will improve, but it can also mean expectations are already high and leave less room for disappointment.
In Apollo’s case, the current P/E of 63.8x is significantly higher than both the peer average of 20.9x and the US diversified financial industry average of 17.1x. It also sits well above the estimated fair P/E of 23.9x, which is a level the market could potentially gravitate toward if expectations cool. That gap between the current multiple and the fair multiple suggests the stock is pricing in a stronger earnings profile than peers and well above what the fair ratio implies.
Result: Price-to-earnings of 63.8x (OVERVALUED)
However, the picture is not one sided, with a revenue growth rate showing around a 97% decline and a 12.84% year to date share price fall raising questions about sustainability.
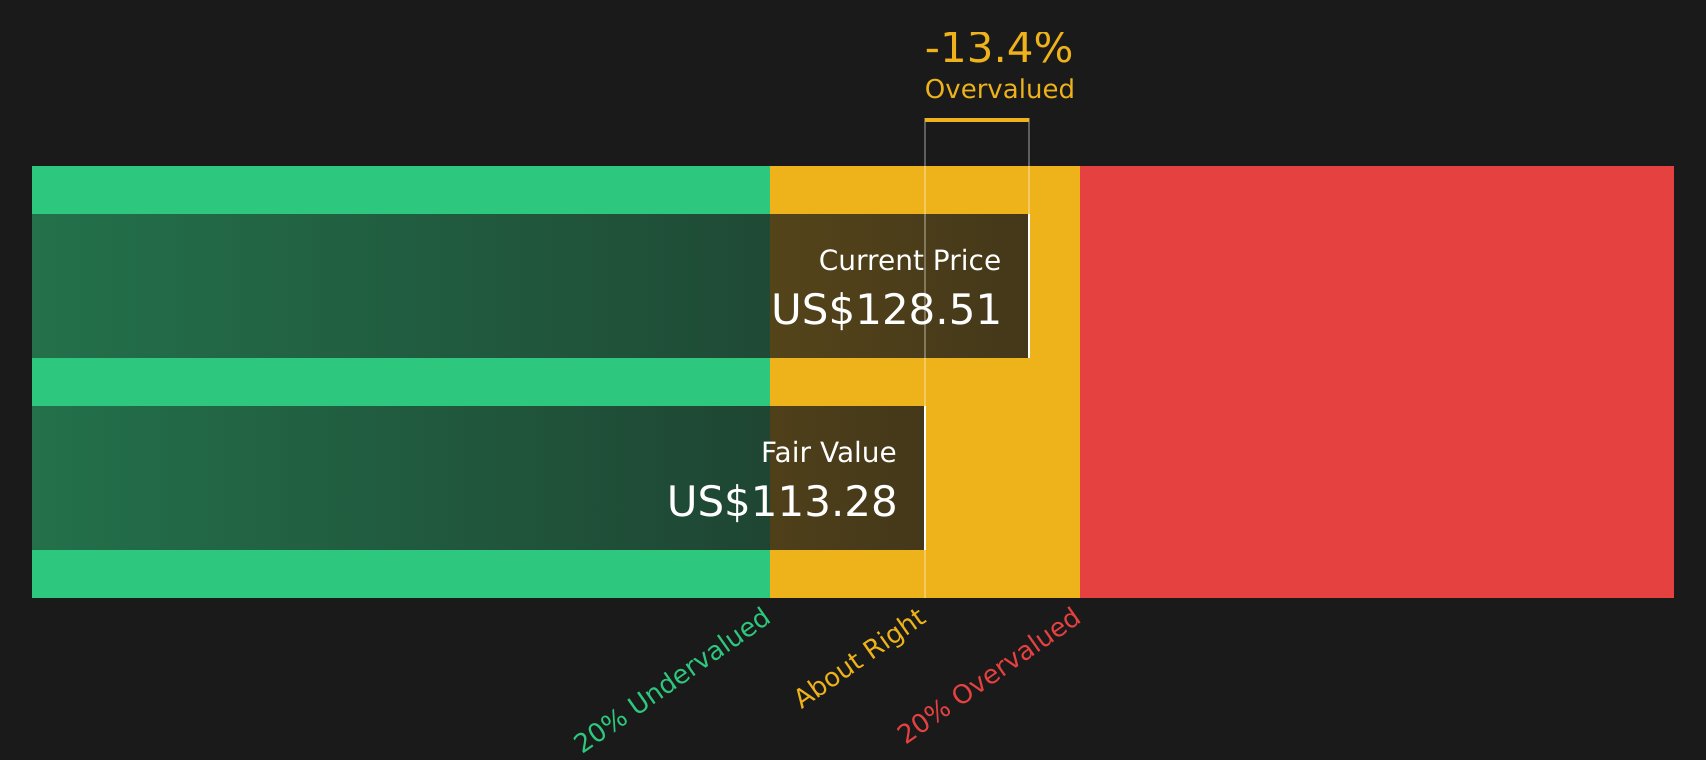
Another View: DCF Says the Stock Looks Cheap
While the 63.8x P/E paints Apollo as expensive, the SWS DCF model points in the opposite direction. At $127.79, the stock is trading about 33% below an estimated future cash flow value of $190.78, which frames the current price as a potential discount rather than a premium. So which story should carry more weight for you right now?
Simply Wall St performs a discounted cash flow (DCF) on every stock in the world every day (check out Apollo Global Management for example). We show the entire calculation in full. You can track the result in your watchlist or portfolio and be alerted when this changes, or use our stock screener to discover 51 high quality undervalued stocks. If you save a screener we even alert you when new companies match - so you never miss a potential opportunity.
Next Steps
Mixed signals on value and growth can split opinion, so if you want a clear stance, move quickly, review the numbers yourself, and weigh up the 2 key rewards and 2 important warning signs
Looking for more investment ideas?
If Apollo has sharpened your focus, do not stop here. Broaden your watchlist now or you risk missing other opportunities that could suit your goals.
- Target potential value opportunities by checking out 51 high quality undervalued stocks that combine quality fundamentals with prices that may not fully reflect them yet.
- Strengthen your pursuit of resilient income by reviewing 12 dividend fortresses offering higher yields backed by solid business profiles.
- Prioritise capital preservation by scanning 71 resilient stocks with low risk scores that score well on financial stability and risk factors.
This article by Simply Wall St is general in nature. We provide commentary based on historical data and analyst forecasts only using an unbiased methodology and our articles are not intended to be financial advice. It does not constitute a recommendation to buy or sell any stock, and does not take account of your objectives, or your financial situation. We aim to bring you long-term focused analysis driven by fundamental data. Note that our analysis may not factor in the latest price-sensitive company announcements or qualitative material. Simply Wall St has no position in any stocks mentioned.