

A Look At Array Digital Infrastructure (AD) Valuation After Governance Proposals Cleared At Annual Meeting
Array Digital AD | 0.00 |
Array Digital Infrastructure (AD) is back on investors’ radar after its 2026 annual shareholder meeting, where all proposals, including officer exculpation and advisory votes on executive pay, received approval and highlighted current sentiment around governance and risk.
At a share price of US$50.67, Array Digital Infrastructure has seen a 5.15% 1 month share price return and a very large 3 year total shareholder return. The weaker year to date share price return of 6.17% suggests momentum has cooled recently as investors weigh the governance approvals, director equity grants and analyst downgrade commentary.
If the governance story here has you thinking about where else capital might work hard in digital infrastructure, this is a good moment to scan 46 AI infrastructure stocks
So with Array Digital Infrastructure sitting at US$50.67, trading only slightly below analyst targets and coming off a mixed run of strong multi year returns but softer recent momentum, is the stock offering value today or is the market already pricing in future growth?
Most Popular Narrative: 5.9% Undervalued
Array Digital Infrastructure's most followed narrative points to a fair value of $53.83 per share, slightly above the last close at $50.67. This frames the current price as modestly below that storyline.
The analysts have a consensus price target of $53.83 for Array Digital Infrastructure based on their expectations of its future earnings growth, profit margins and other risk factors. However, there is a degree of disagreement amongst analysts, with the most bullish reporting a price target of $60.0, and the most bearish reporting a price target of just $45.0.
Want to see what is sitting underneath that fair value label? The narrative leans on specific revenue growth, margin compression and a punchy future earnings multiple. Curious which assumptions really do the heavy lifting for that $53.83 figure?
Result: Fair Value of $53.83 (UNDERVALUED)
However, this story can shift quickly if the T-Mobile transaction encounters regulatory delays or if tougher competition continues to pressure service revenues and profitability.
Another View: Cash Flow Model Paints a Tougher Picture
Analysts see Array Digital Infrastructure as 5.9% undervalued at US$50.67, but the Simply Wall St DCF model comes out very differently. On that cash flow view, AD looks expensive, with the share price sitting above an estimated value of about US$41.27. This raises the question of which story you trust more.
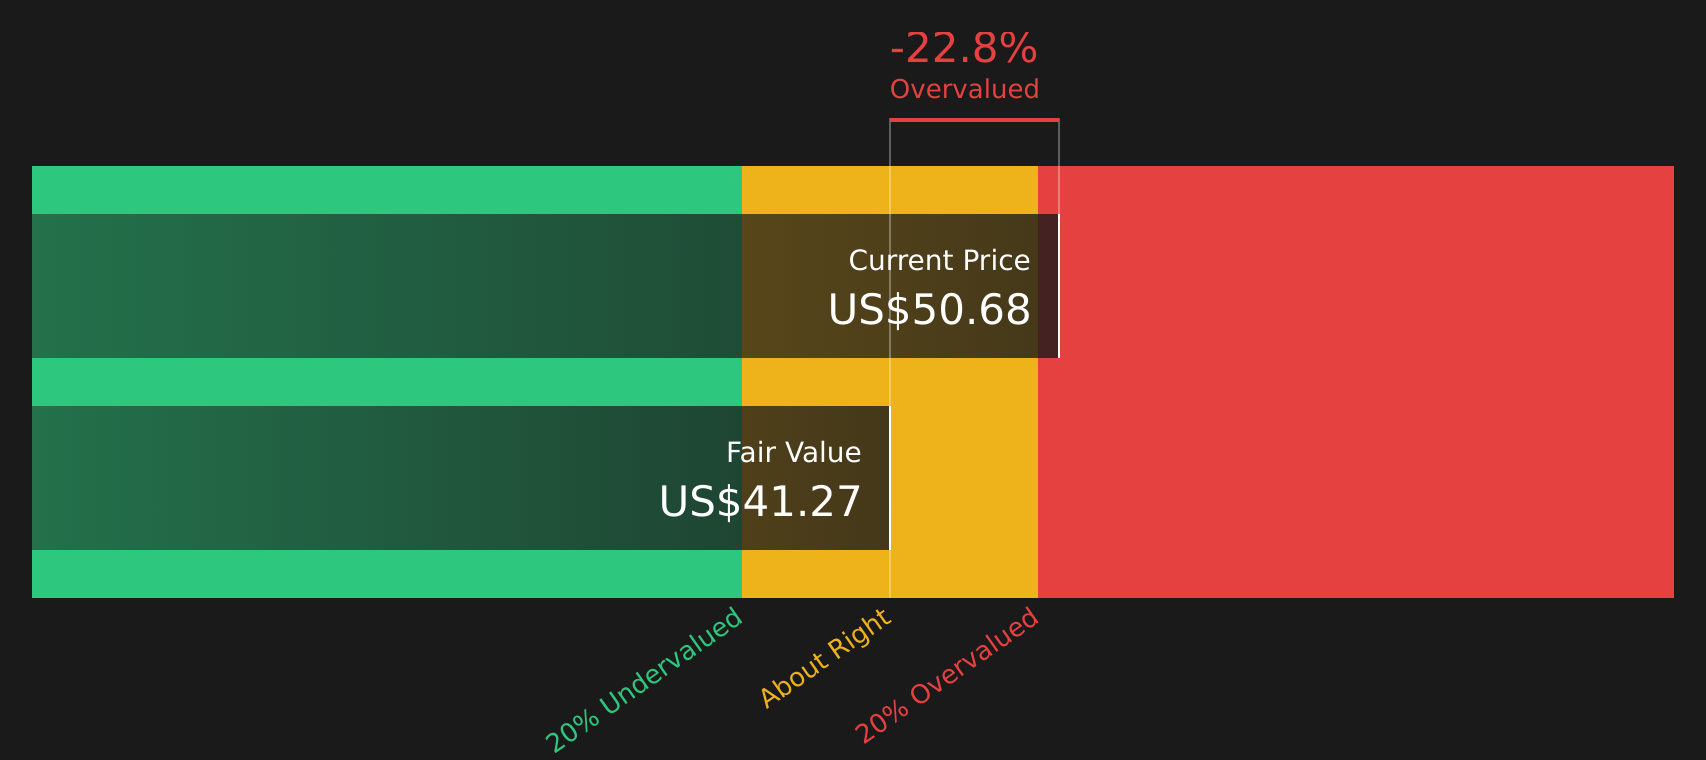
Simply Wall St performs a discounted cash flow (DCF) on every stock in the world every day (check out Array Digital Infrastructure for example). We show the entire calculation in full. You can track the result in your watchlist or portfolio and be alerted when this changes, or use our stock screener to discover 48 high quality undervalued stocks. If you save a screener we even alert you when new companies match - so you never miss a potential opportunity.
Next Steps
Does this mix of risks, rewards, and valuation opinions feel balanced to you, or skewed one way? Act while the information is fresh and pressure test the narrative against the data by reviewing the 2 key rewards and 2 important warning signs.
Looking for more investment ideas?
If this Array Digital Infrastructure story sharpened your thinking, do not stop here. Fresh ideas often come from comparing different types of opportunities side by side.
- Target potential mispricings by scanning 48 high quality undervalued stocks that combine solid fundamentals with prices that may not fully reflect their financial profile.
- Strengthen your income watchlist by reviewing 10 dividend fortresses that pair higher yields with balance sheets you can scrutinize in one place.
- Reduce portfolio stress by focusing on 65 resilient stocks with low risk scores that score well on financial health and measured risk factors.
This article by Simply Wall St is general in nature. We provide commentary based on historical data and analyst forecasts only using an unbiased methodology and our articles are not intended to be financial advice. It does not constitute a recommendation to buy or sell any stock, and does not take account of your objectives, or your financial situation. We aim to bring you long-term focused analysis driven by fundamental data. Note that our analysis may not factor in the latest price-sensitive company announcements or qualitative material. Simply Wall St has no position in any stocks mentioned.