A Look At Ball (BALL) Valuation As Recent Share Price Weakness Meets DCF Upside Potential
Ball Corporation BALL | 0.00 |
Why Ball (BALL) is on investors’ radar today
Ball (BALL) has drawn fresh attention as investors reassess the aluminum packaging specialist after recent share price moves, with the stock down over the past week and the past 3 months, yet still positive year to date.
Recent trading shows momentum fading, with a 1-day share price return of 1% decline, a 7-day share price return of 4.37% decline, and a 90-day share price return of 12.13% decline, even as the year-to-date share price return is 9.48% and the 1-year total shareholder return is 14.46%.
If Ball’s recent moves have you reassessing your watchlist, this can be a useful moment to widen your search and check out 19 top founder-led companies
With Ball trading at $58.41, a price target implying roughly 21% upside, and some measures suggesting a wider intrinsic discount, you have to ask yourself: is this a buying opportunity, or is the market already pricing in future growth?
Price-to-Earnings of 16.6x: Is it justified?
On a P/E of 16.6x, Ball is priced slightly below its estimated fair P/E of 20.3x and a touch below its peer average of 17.1x, while sitting above the global packaging industry average of 15.6x.
The P/E multiple compares the current share price with earnings per share, so it shows how much you are paying for each dollar of profit. For a mature, profitable packaging business like Ball, this is a common yardstick because earnings are a key driver of shareholder return and cash generation.
Ball appears to offer relatively good value compared with its estimated fair P/E and the peer group, indicating that the market is not assigning a notable premium to its earnings. Earnings have grown 77.6% over the past year and are expected to grow at 8.51% per year, based on current forecasts. Compared with the global packaging industry average P/E of 15.6x, the current 16.6x still implies a modestly higher price for each dollar of earnings, which the market could be using to reflect its earnings quality and improved net profit margin.
Result: Price-to-Earnings of 16.6x (UNDERVALUED).
However, recent share price declines over 7 days, 30 days, and 90 days, along with a 5 year total shareholder return decline of 29.63%, could signal persistent investor caution.
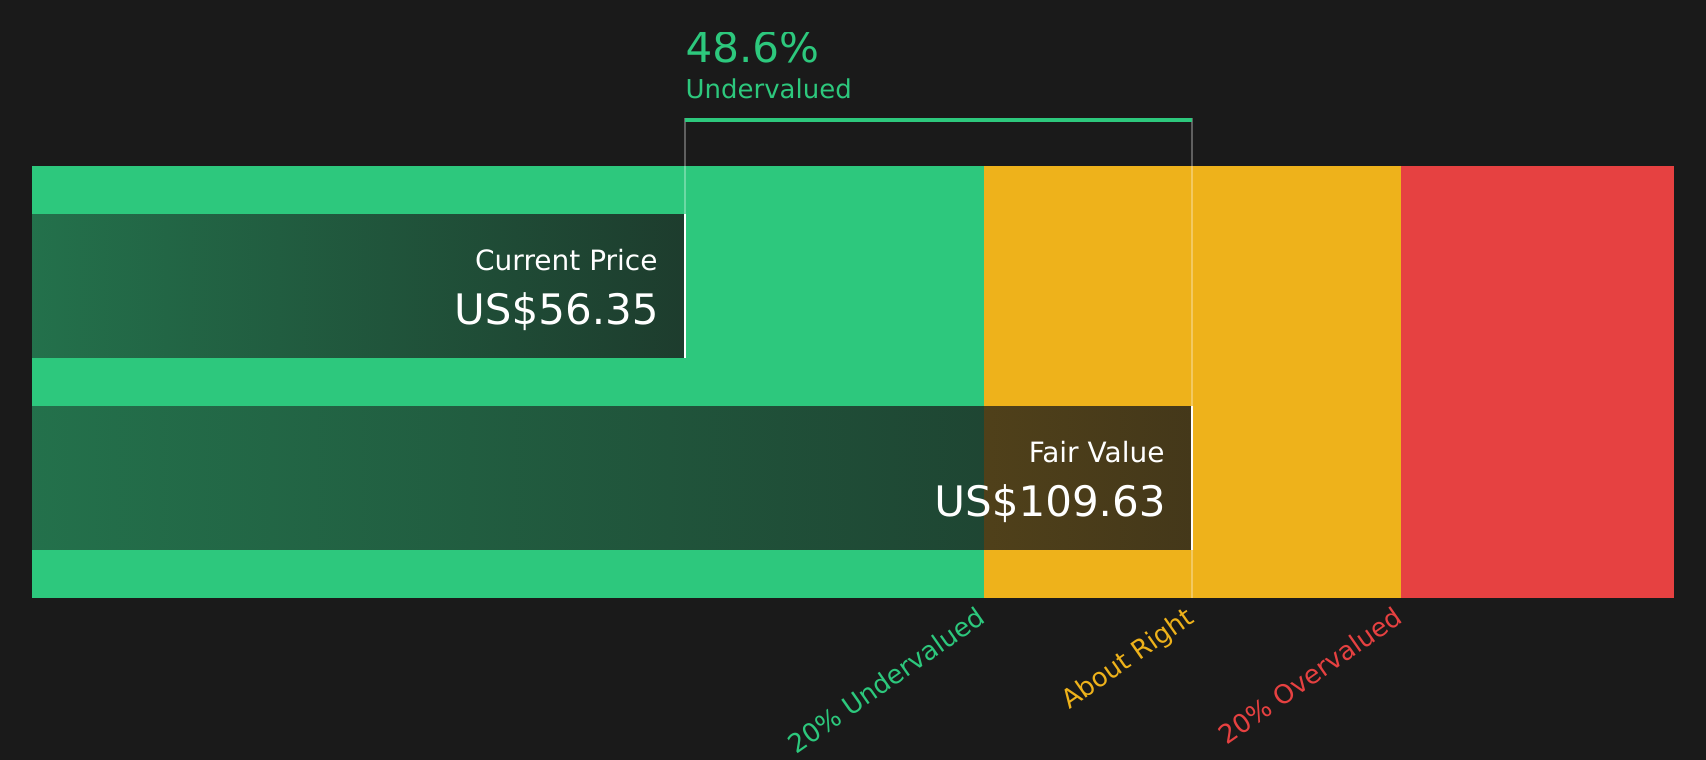
Another angle: the SWS DCF model
The P/E suggests Ball is slightly cheap, but the SWS DCF model is far more aggressive, with an estimated future cash flow value of $109.08 per share versus the current $58.41. That points to very material undervaluation, so which signal should you trust more?
Simply Wall St performs a discounted cash flow (DCF) on every stock in the world every day (check out Ball for example). We show the entire calculation in full. You can track the result in your watchlist or portfolio and be alerted when this changes, or use our stock screener to discover 51 high quality undervalued stocks. If you save a screener we even alert you when new companies match - so you never miss a potential opportunity.
Next Steps
If this mix of potential upside and clear risks feels balanced, now is the time to check the data yourself and decide where you stand. You can start with 4 key rewards and 2 important warning signs.
Looking for more investment ideas?
If Ball has sharpened your focus, do not stop there. Use the Simply Wall Street Screener to quickly spot other stocks that might deserve a place on your radar.
- Target dependable income by reviewing 12 dividend fortresses that may suit investors who want meaningful yield backed by underlying cash flows.
- Hunt for potential value by scanning 51 high quality undervalued stocks that combine quality fundamentals with pricing that may be out of step with current expectations.
- Prioritise resilience by examining 72 resilient stocks with low risk scores that score well on financial stability and business risk, so you do not overlook steadier options.
This article by Simply Wall St is general in nature. We provide commentary based on historical data and analyst forecasts only using an unbiased methodology and our articles are not intended to be financial advice. It does not constitute a recommendation to buy or sell any stock, and does not take account of your objectives, or your financial situation. We aim to bring you long-term focused analysis driven by fundamental data. Note that our analysis may not factor in the latest price-sensitive company announcements or qualitative material. Simply Wall St has no position in any stocks mentioned.