A Look At BGC Group (BGC) Valuation After Record Revenue And Upbeat Growth Outlook
BGC Group, Inc. Class A BGC | 9.98 | +1.42% |
Why BGC Group stock is back on investors’ radar
BGC Group (BGC) has drawn fresh attention after reporting record annual revenue near US$3b, solid profit for 2025, and outlining an upbeat outlook for early 2026, including new revenue initiatives.
After the earnings release and guidance, BGC Group’s share price is at US$9.21, with a 30 day share price return of 3.48% and a 3 year total shareholder return of about 2.1x. This suggests momentum has built over time despite short term swings.
If this earnings update has you looking beyond a single name, it could be a good moment to broaden your watchlist with 23 top founder-led companies as potential long term compounders to research next.
With the share price at US$9.21, a 3 year total return of about 2.1x, record revenue near US$3b and a price target of US$14.50, is BGC still mispriced, or is the market already baking in future growth?
Most Popular Narrative: 36.5% Undervalued
Against BGC Group's last close at $9.21, the most widely followed narrative points to a fair value of $14.50, built on an aggressive shift toward electronic trading and higher margin businesses.
Continued expansion and strong revenue growth from BGC's electronic trading platforms (notably Fenics and FMX), supported by substantial increases in electronic volumes and market share across asset classes, suggest that BGC is positioned to capitalize on the accelerating shift toward technology-driven trading. This is likely to boost top-line revenue and expand margins due to the higher scalability and profitability of electronic versus voice-driven trading.
Curious what kind of revenue mix and margin profile have to line up to support that fair value? The narrative leans heavily on compounding electronic volumes, rising profitability and disciplined capital returns, but the real story is in how those pieces are stitched together over the next few years.
Result: Fair Value of $14.50 (UNDERVALUED)
However, those upbeat assumptions could unravel if trading volatility cools faster than expected or recent acquisitions fall short of the planned US$25m cost savings.
Another View: When Cash Flows Tell a Different Story
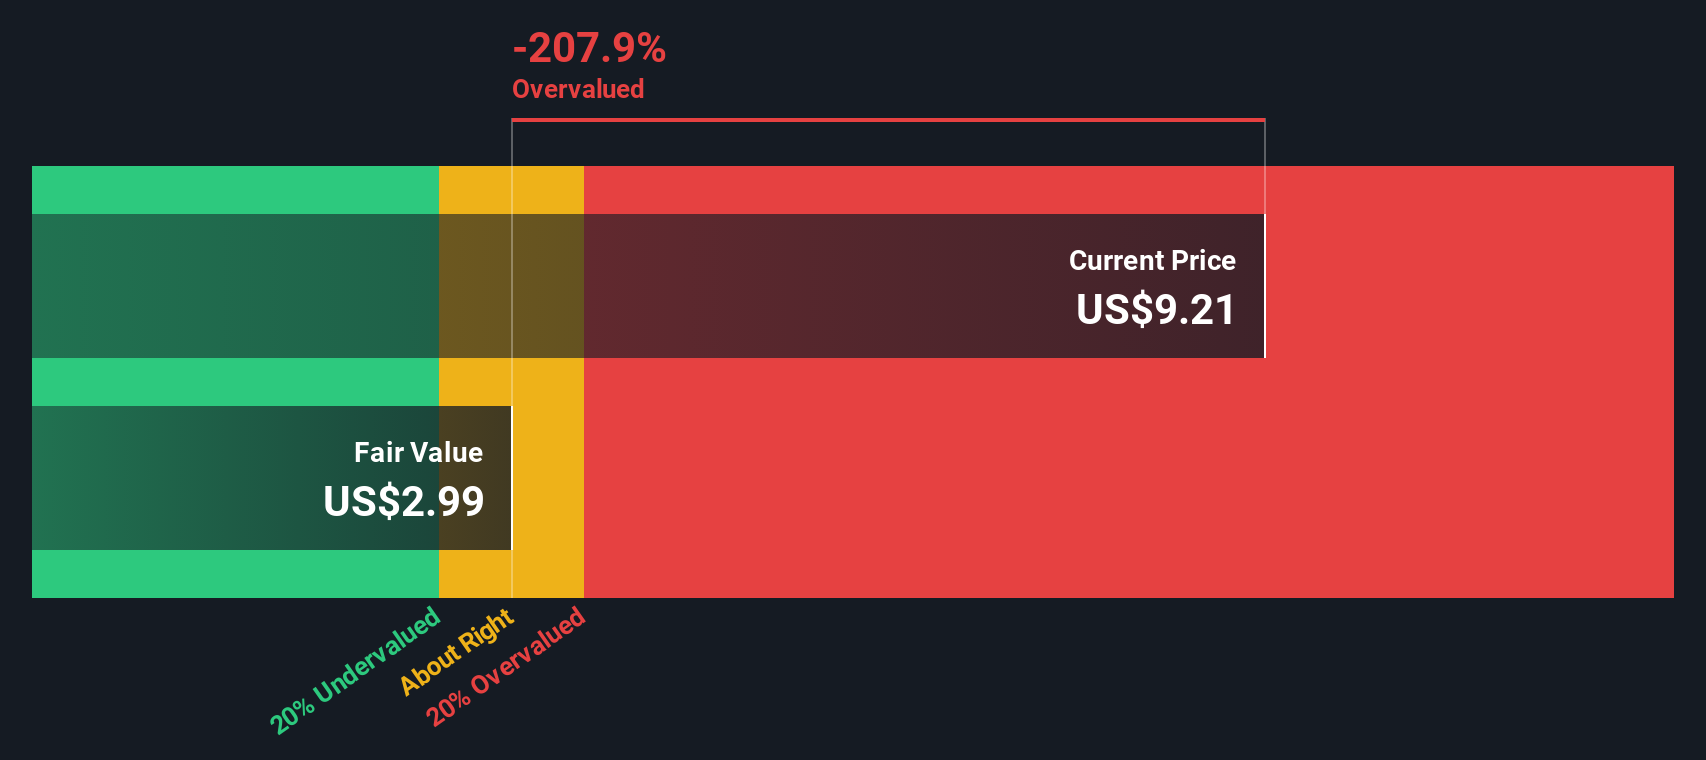
While the consensus narrative sees BGC Group as 36.5% undervalued at a fair value of $14.50, the Simply Wall St DCF model comes out far more conservative, with an estimate of $2.86 per share and BGC trading well above that today. Which story do you think is closer to reality?
Simply Wall St performs a discounted cash flow (DCF) on every stock in the world every day (check out BGC Group for example). We show the entire calculation in full. You can track the result in your watchlist or portfolio and be alerted when this changes, or use our stock screener to discover 53 high quality undervalued stocks. If you save a screener we even alert you when new companies match - so you never miss a potential opportunity.
Build Your Own BGC Group Narrative
If you are not fully on board with these narratives or prefer to stress test the numbers yourself, you can build a tailored view of BGC Group in just a few minutes: Do it your way
A great starting point for your BGC Group research is our analysis highlighting 2 key rewards and 2 important warning signs that could impact your investment decision.
Looking for more investment ideas?
If BGC Group is on your radar, do not stop there. Use this momentum to line up a few more high quality ideas worth your time.
- Spot potential bargains early by scanning our list of 53 high quality undervalued stocks that pair quality fundamentals with prices that may not fully reflect them.
- Build a sturdier core for your portfolio by checking out a solid balance sheet and fundamentals stocks screener (44 results) that aims to keep financial risk in check.
- Put your cash to work with income ideas by reviewing a curated set of 13 dividend fortresses that focus on stronger yield profiles.
This article by Simply Wall St is general in nature. We provide commentary based on historical data and analyst forecasts only using an unbiased methodology and our articles are not intended to be financial advice. It does not constitute a recommendation to buy or sell any stock, and does not take account of your objectives, or your financial situation. We aim to bring you long-term focused analysis driven by fundamental data. Note that our analysis may not factor in the latest price-sensitive company announcements or qualitative material. Simply Wall St has no position in any stocks mentioned.