A Look At Chart Industries (GTLS) Valuation After Recent Mixed Returns And Order Book Momentum
Chart Industries, Inc. GTLS | 208.40 | +0.28% |
What Chart Industries’ recent performance data tells you
Chart Industries (GTLS) has drawn investor attention after recent share performance data highlighted mixed short term moves alongside stronger multi year returns, prompting closer scrutiny of how current fundamentals line up with the price.
At a share price of $207.45, Chart Industries has seen only modest recent share price moves. A 1 year total shareholder return of 5.59% and a 3 year total shareholder return of 51.46% point to stronger longer term momentum.
If you are looking beyond a single stock in the industrial and energy infrastructure space, our screener of 24 power grid technology and infrastructure stocks is a straightforward way to spot other potential ideas.
With Chart trading around $207 and an estimated intrinsic value gap of roughly 30%, plus solid multi year total returns, is the stock still offering a margin of safety, or is the market already pricing in future growth?
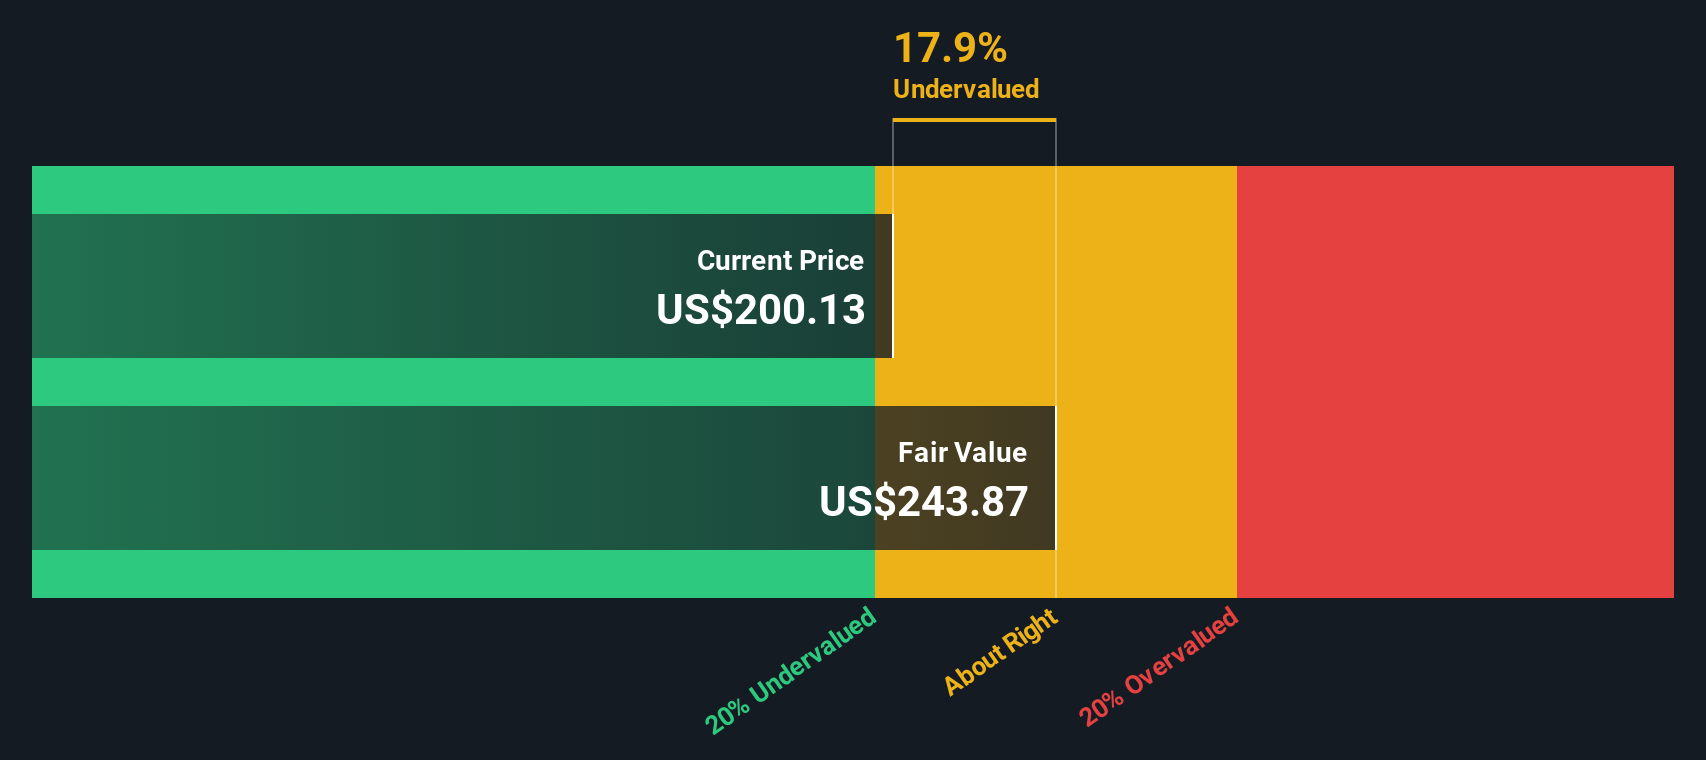
Most Popular Narrative: 0.4% Overvalued
At around $207, Chart Industries is trading slightly above a widely followed fair value estimate of about $206, which rests on a detailed long term growth story.
Chart Industries is experiencing a significant increase in order volume, including a 17.3% increase from the first quarter of 2024 to the first quarter of 2025, which could enhance future revenue as these orders are fulfilled. The company is strategically positioned in high demand markets such as LNG, data centers, and space exploration, providing a strong pipeline of future projects and potential for significant revenue growth.
Curious how this order book, margin uplift and long runway in LNG and data centers translate into that fair value line? The underlying earnings ramp, revenue mix shift and profit margin targets form the backbone of this narrative. Want to see how those assumptions stack up against the current $207 price tag?
Result: Fair Value of $206.67 (OVERVALUED)
However, there are still pressure points, including reliance on tariff exemptions and uncertain industrial gas and hydrogen demand, that could upset those margin and revenue assumptions.
Another angle on Chart’s valuation
While the consensus narrative has Chart trading about 0.4% above a $206.67 fair value, our SWS DCF model presents a different perspective, with a future cash flow value of $295.27 per share. That indicates a sizeable gap. Which view do you think better reflects the risks you care about?
Build Your Own Chart Industries Narrative
If you look at the numbers and reach a different conclusion, or simply prefer your own research, you can build a personal view in just a few minutes: Do it your way.
A great starting point for your Chart Industries research is our analysis highlighting 2 key rewards and 3 important warning signs that could impact your investment decision.
Looking for more investment ideas?
If Chart Industries has sharpened your focus, do not stop here. Broaden your watchlist with a few targeted ideas that match how you like to invest.
- Target companies that look mispriced by screening for value driven opportunities through our list of 53 high quality undervalued stocks.
- Prioritise resilience by zeroing in on businesses highlighted in our 86 resilient stocks with low risk scores that score well on risk metrics.
- Hunt for lesser known opportunities by reviewing our screener containing 24 high quality undiscovered gems that pair strong fundamentals with relatively low market attention.
This article by Simply Wall St is general in nature. We provide commentary based on historical data and analyst forecasts only using an unbiased methodology and our articles are not intended to be financial advice. It does not constitute a recommendation to buy or sell any stock, and does not take account of your objectives, or your financial situation. We aim to bring you long-term focused analysis driven by fundamental data. Note that our analysis may not factor in the latest price-sensitive company announcements or qualitative material. Simply Wall St has no position in any stocks mentioned.