A Look At CME Group (CME) Valuation After Record 2025 Derivatives Trading Volumes
CME Group Inc. Class A CME | 305.11 | +2.75% |
CME Group (CME) is back in focus after reporting record average daily volume of 28.1 million contracts in 2025, with strong interest rate and cryptocurrency derivatives activity reshaping how some investors view the stock.
Despite the headline of record trading volumes and new product launches across crypto and interest rate derivatives, CME Group’s 1-day and recent multi week share price returns are slightly negative, while its 1 year and multi year total shareholder returns remain firmly positive, suggesting longer term momentum has been stronger than the latest share price moves imply.
If CME’s volumes have you thinking about where liquidity could matter next, it might be worth scanning fast growing stocks with high insider ownership as a way to spot fresh ideas beyond large established exchanges.
CME’s shares are roughly flat to slightly weaker over 1 day to 3 months, despite solid multi year total returns and record trading volumes. Is this a chance to gain quality exposure to derivatives infrastructure, or is the market already pricing in future growth?
Most Popular Narrative: 7.1% Undervalued
The most followed narrative pegs CME Group’s fair value at about US$287 per share, a touch above the last close of US$266.64, framing the current setup as modest upside rather than a huge gap.
The ongoing global shift toward electronic trading, greater regulatory demands for transparency and standardized clearing, and a proven ability to grow non-transactional revenue (e.g., record market data revenue) position CME to capture a larger share of trading activity and support durable long-term earnings growth.
Curious what kind of revenue mix and margin profile are baked into that fair value, and why the projected earnings multiple stretches beyond the wider capital markets group? The most popular narrative lays out a detailed path built on measured growth, robust profitability and a richer P/E a few years out, all underpinned by a specific discount rate and tight analyst agreement on future earnings power.
Result: Fair Value of $287.07 (UNDERVALUED)
However, this narrative could be challenged if volatility stays muted for a long stretch or if DeFi style platforms continue to steadily chip away at CME’s market share.
Another View: Multiples Point To A Richer Price
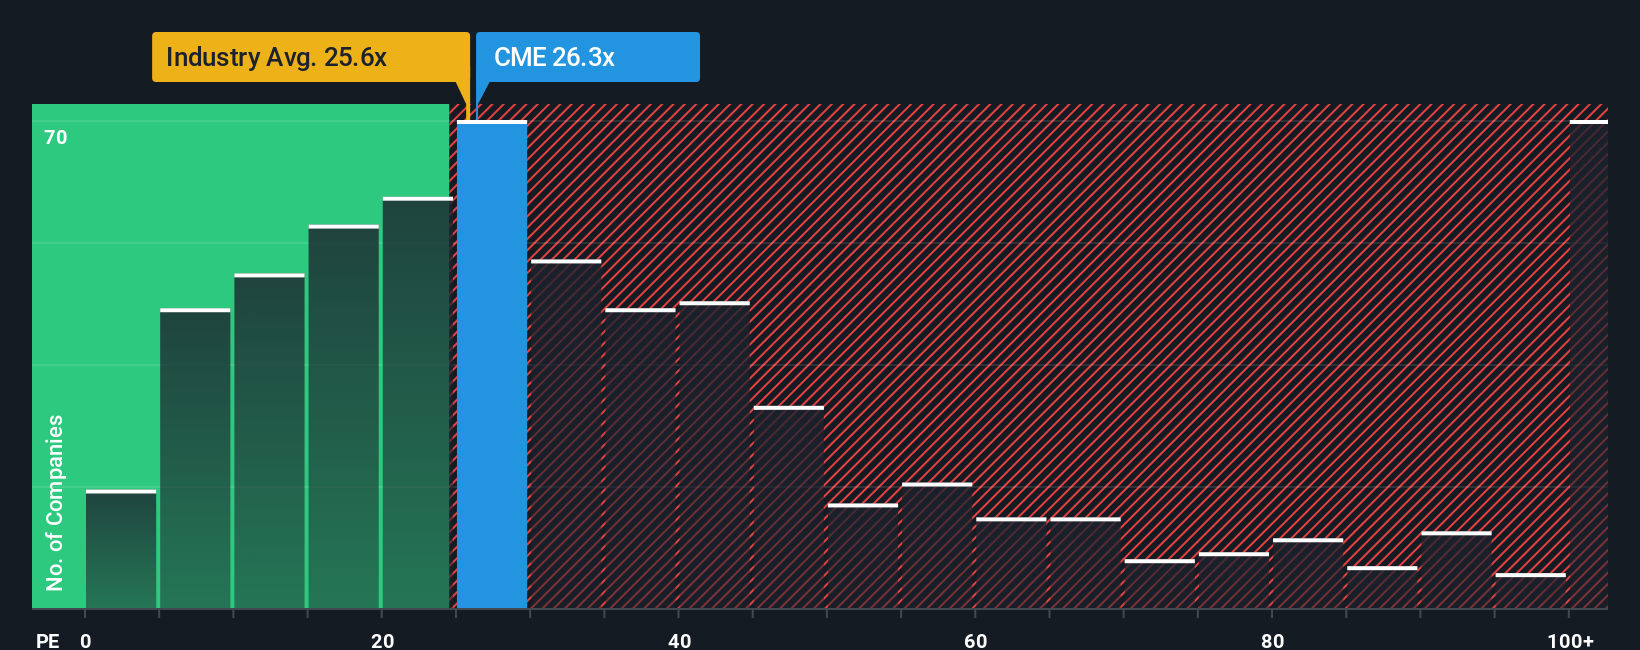
The fair value narrative suggests modest upside, but the ratios tell a tougher story. CME trades on a P/E of 25.9x, close to the US Capital Markets average of 25.8x and below peers at 36.3x, yet above a fair ratio of 15.8x, which flags meaningful valuation risk if sentiment cools.
Build Your Own CME Group Narrative
If you see the numbers differently or prefer to test your own assumptions, you can build a full CME story yourself in minutes, starting with Do it your way.
A great starting point for your CME Group research is our analysis highlighting 1 key reward and 2 important warning signs that could impact your investment decision.
Looking for more investment ideas?
If CME has your attention, do not stop there. Broaden your watchlist with targeted screens that surface different types of opportunities across sectors and themes.
- Spot potential value setups by scanning these 874 undervalued stocks based on cash flows that currently trade below what their cash flows suggest.
- Explore trends in automation and data by checking out these 28 AI penny stocks at the front line of artificial intelligence.
- Strengthen your income focus by reviewing these 11 dividend stocks with yields > 3% that offer yields above 3% while you assess longer term prospects.
This article by Simply Wall St is general in nature. We provide commentary based on historical data and analyst forecasts only using an unbiased methodology and our articles are not intended to be financial advice. It does not constitute a recommendation to buy or sell any stock, and does not take account of your objectives, or your financial situation. We aim to bring you long-term focused analysis driven by fundamental data. Note that our analysis may not factor in the latest price-sensitive company announcements or qualitative material. Simply Wall St has no position in any stocks mentioned.