A Look At Consolidated Edison (ED) Valuation After Its Recent Dividend Increase
Consolidated Edison, Inc. ED | 115.43 | +1.33% |
Dividend increase as a fresh signal for income-focused investors
Consolidated Edison (ED) has declared a quarterly dividend of $0.8875 per share, an annualized increase of $0.15 compared with the previous $3.40. This development is putting fresh attention on the stock for income-oriented investors.
At a share price of $107.34, Consolidated Edison has recorded a 30 day share price return of 8.19% and a 1 year total shareholder return of 14.83%. This suggests momentum has been building alongside this dividend increase and recent earnings driven updates.
If this dividend news has you thinking about where else steady returns might come from, it could be a good time to scan our 24 power grid technology and infrastructure stocks as a starting shortlist.
With the stock around $107.34, a value score of 3, and estimates suggesting a small premium to analyst and intrinsic values, you have to ask: is there still an entry point here, or is the market already pricing in future growth?
Preferred P/E of 19x: Is it justified?
With Consolidated Edison trading at $107.34, the current P/E of 19x sits slightly below the broader US market and below both peer and industry averages, which points to a valuation that looks restrained rather than stretched.
The P/E ratio compares the share price to earnings per share, so a 19x multiple reflects what investors are currently willing to pay for each dollar of earnings. For a regulated utility with relatively steady earnings, P/E is a common yardstick because cash flows tend to be more predictable than in many other sectors.
Here, ED screens as good value in several ways: its 19x P/E is below the US market P/E of 19.5x, below the peer average of 20.8x, and a touch under the global Integrated Utilities average of 19.2x. The estimated fair P/E of 22.7x is also higher than where the shares are now. This sets a level the market could move towards if current earnings quality and growth trends are sustained.
Result: Price-to-Earnings of 19x (ABOUT RIGHT)
However, you still need to weigh risks such as potential regulatory changes in its core New York markets and any setback to earnings that could pressure the current multiple.
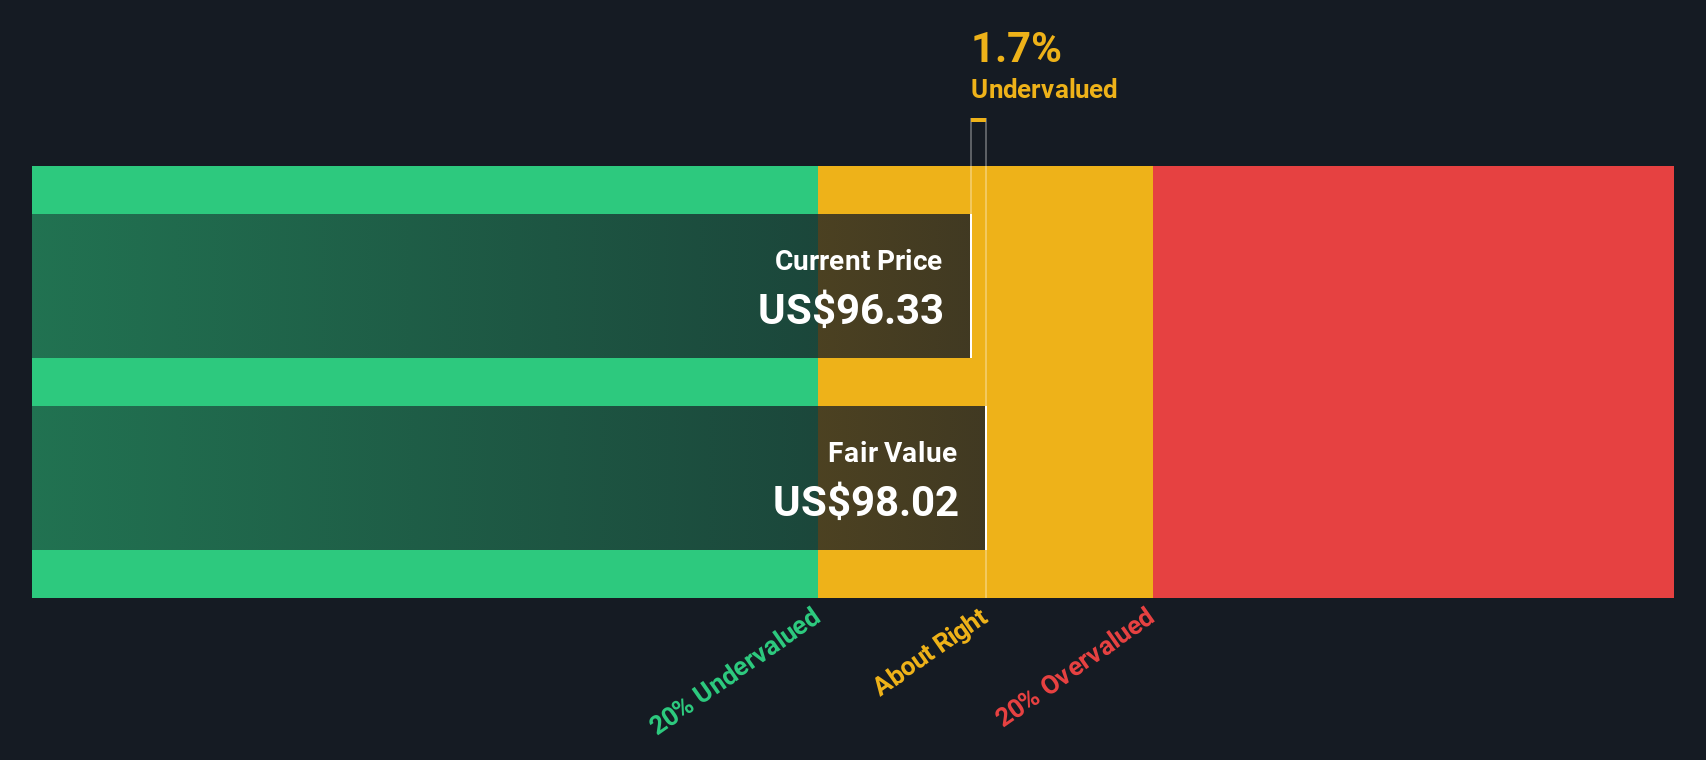
Another view using our DCF model
While the 19x P/E suggests Consolidated Edison looks reasonably priced against peers, our DCF model tells a different story. With the shares at $107.34 and our future cash flow value at $103.61, the stock screens as slightly overvalued, which may limit upside if sentiment cools.
Simply Wall St performs a discounted cash flow (DCF) on every stock in the world every day (check out Consolidated Edison for example). We show the entire calculation in full. You can track the result in your watchlist or portfolio and be alerted when this changes, or use our stock screener to discover 52 high quality undervalued stocks. If you save a screener we even alert you when new companies match - so you never miss a potential opportunity.
Build Your Own Consolidated Edison Narrative
If you see the numbers differently or prefer to test your own assumptions, you can build and stress test a custom view in a few minutes: Do it your way.
A great starting point for your Consolidated Edison research is our analysis highlighting 4 key rewards and 2 important warning signs that could impact your investment decision.
Looking for more investment ideas?
If you want to round out your watchlist beyond Consolidated Edison, this is the moment to scan a few focused ideas and see what stands out for you.
- Lock in potential income streams by reviewing companies in our 14 dividend fortresses that prioritize reliable shareholder payouts.
- Spot potential value candidates early by checking the screener containing 24 high quality undiscovered gems that combine strong fundamentals with limited market attention.
- Give yourself more peace of mind by concentrating on the 84 resilient stocks with low risk scores that score well on resilience and overall risk profiles.
This article by Simply Wall St is general in nature. We provide commentary based on historical data and analyst forecasts only using an unbiased methodology and our articles are not intended to be financial advice. It does not constitute a recommendation to buy or sell any stock, and does not take account of your objectives, or your financial situation. We aim to bring you long-term focused analysis driven by fundamental data. Note that our analysis may not factor in the latest price-sensitive company announcements or qualitative material. Simply Wall St has no position in any stocks mentioned.