A Look At Consolidated Edison’s Valuation As Officials Challenge Proposed 2026–2028 Rate Hikes
Consolidated Edison, Inc. ED | 115.43 | +1.33% |
Why the new rate hike opposition matters for Consolidated Edison (ED)
Officials representing about 9 million New Yorkers are urging regulators to reject Consolidated Edison (ED) rate hikes for 2026 to 2028. They argue that even reduced electricity and gas increases strain households and small businesses.
Consolidated Edison’s share price has moved to $103.81, with a 1-day share price return of 1.20% and a 7-day share price return of 4.64%, while its 1-year total shareholder return of 14.67% and 5-year total shareholder return of 80.44% point to momentum that has built over time as investors weigh the latest rate hike opposition and the upcoming 2025 earnings release on February 19, 2026.
If this rate debate has you thinking more broadly about utilities and beyond, it could be a useful moment to compare opportunities across stable growth stocks screener (None results).
With the share price near its analyst target, a low value score of 2, and annual revenue and net income growth of 3.63% and 7.76%, you have to ask: is there hidden upside here, or is the market already pricing in future growth?
Price-to-Earnings of 18.4x: Is it justified?
Consolidated Edison is trading on a P/E of 18.4x, which sits slightly below the US market average and just above the global integrated utilities peer group.
The P/E ratio links the current share price to per share earnings. It gives a quick sense of how much investors are paying for each dollar of profit in a regulated, earnings-focused business such as utilities.
According to the assessment, this P/E is described as good value when compared with the broader US market P/E of 19.5x and with an estimated fair P/E of 21.6x. This suggests the current multiple sits under a level the market could move toward if sentiment or earnings expectations shift.
Against the global integrated utilities average P/E of 18.3x, however, Consolidated Edison is described as a little expensive, so investors are paying a small premium versus direct peers for its earnings profile.
Result: Price-to-Earnings of 18.4x (ABOUT RIGHT)
However, this picture can change quickly if regulators take a tougher line on future rate cases or if higher funding costs begin to put pressure on regulated returns.
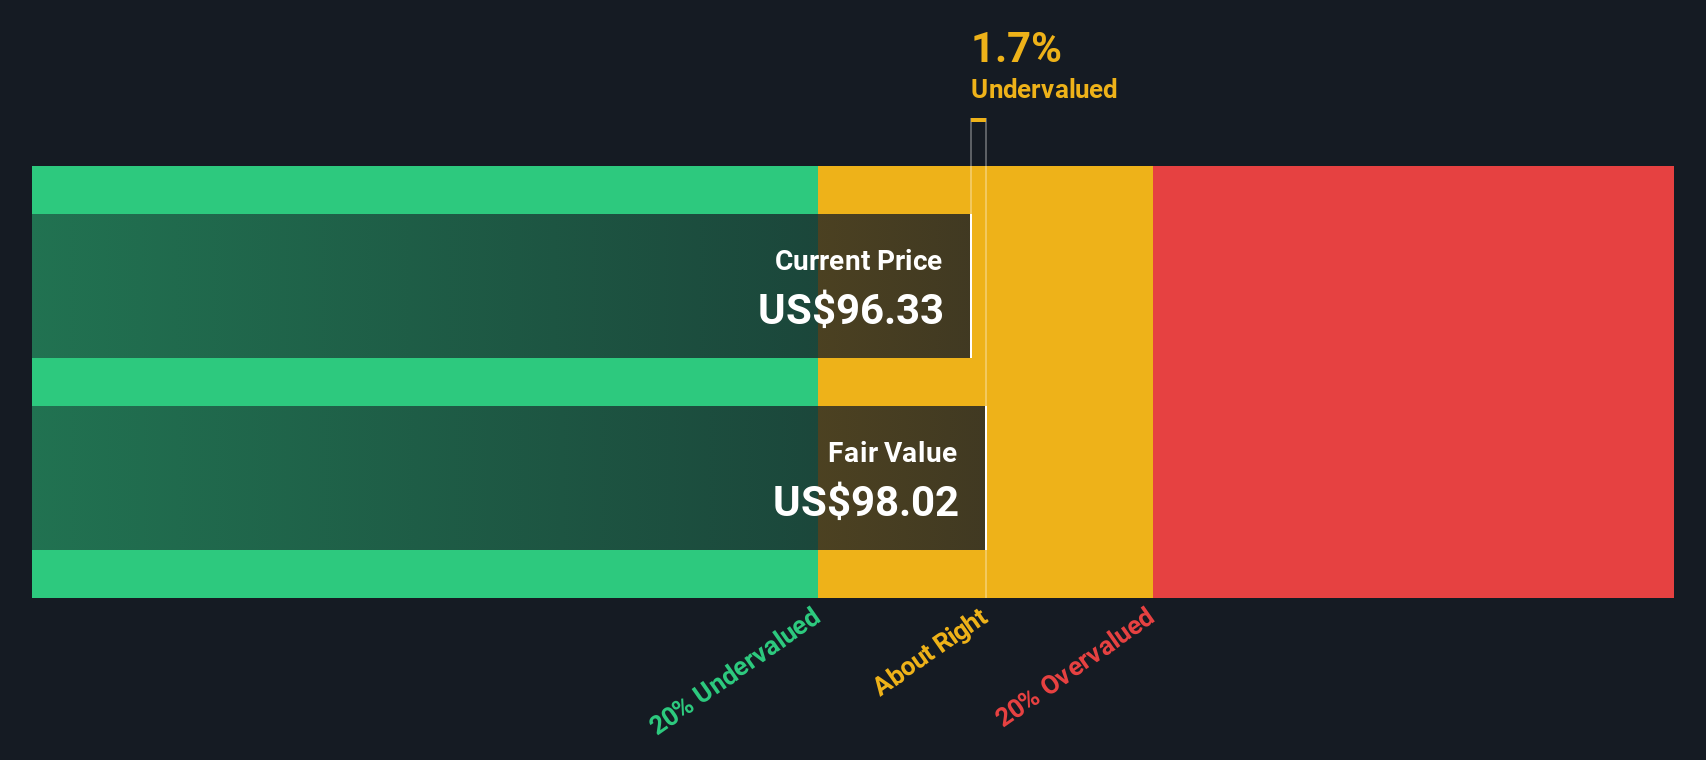
Another View: Our DCF Model Points the Other Way
The P/E discussion paints ED as roughly fairly priced, but our DCF model tells a different story. With the shares at US$103.81 and an estimated fair value of US$99.62, the DCF view frames ED as slightly overvalued. This is a small but important gap for anyone thinking about risk versus comfort.
It raises a simple question for you as an investor: do you lean more on today’s earnings multiple or on the cash flow assumptions sitting inside a model like this?
Simply Wall St performs a discounted cash flow (DCF) on every stock in the world every day (check out Consolidated Edison for example). We show the entire calculation in full. You can track the result in your watchlist or portfolio and be alerted when this changes, or use our stock screener to discover 863 undervalued stocks based on their cash flows. If you save a screener we even alert you when new companies match - so you never miss a potential opportunity.
Build Your Own Consolidated Edison Narrative
If you see the numbers differently, or simply prefer to work through the data on your own terms, you can build a custom view of ED in just a few minutes. To get started, use Do it your way.
A great starting point for your Consolidated Edison research is our analysis highlighting 3 key rewards and 2 important warning signs that could impact your investment decision.
Looking for more investment ideas?
If you stop at one stock, you miss the bigger picture. Use the Simply Wall St Screener to quickly spot focused ideas that might better suit your goals.
- Target potential value by checking out these 863 undervalued stocks based on cash flows, where you can concentrate on companies that appear cheaply priced against their cash flows.
- Ride structural themes by scanning these 24 AI penny stocks, which highlights businesses tied to artificial intelligence trends across different sectors.
- Broaden your toolkit with these 80 cryptocurrency and blockchain stocks, giving you a way to assess stocks linked to cryptocurrencies and blockchain technology in one place.
This article by Simply Wall St is general in nature. We provide commentary based on historical data and analyst forecasts only using an unbiased methodology and our articles are not intended to be financial advice. It does not constitute a recommendation to buy or sell any stock, and does not take account of your objectives, or your financial situation. We aim to bring you long-term focused analysis driven by fundamental data. Note that our analysis may not factor in the latest price-sensitive company announcements or qualitative material. Simply Wall St has no position in any stocks mentioned.