A Look At Duke Energy (DUK) Valuation After Full Year 2025 Earnings Growth
Duke Energy Corporation DUK | 0.00 |
Duke Energy (DUK) shares are in focus after the company reported fourth quarter and full year 2025 results, with full year revenue of US$32.24b and net income of US$4.97b.
Duke Energy’s recent earnings release has coincided with improving momentum, with a 1 day share price return of 1.66%, a 1 month share price return of 7.53%, and a 1 year total shareholder return of 18.94%. This suggests investors are responding to steady financial progress and reassessing the company’s risk and income profile.
If results like these have you reassessing your watchlist, it could be a good moment to look at 25 power grid technology and infrastructure stocks as potential complementary ideas alongside a regulated utility like Duke Energy.
With Duke Energy now trading near US$128 after steady share price gains and reporting full year revenue of US$32.24b and net income of US$4.97b, the key question is whether there is still a buying opportunity here or if the market is already pricing in future growth.
Most Popular Narrative: 4.8% Undervalued
At a last close of $128.20 versus a narrative fair value of about $134.71, Duke Energy is framed as modestly undervalued, with that view built on detailed revenue, margin and valuation assumptions.
Major economic development wins (e.g., AWS's $10B data center in North Carolina), paired with accelerated migration and manufacturing demand in Duke's service territory, are expected to drive robust, multi-year load and volume growth, supporting higher revenues and long-term EPS growth.
Curious what has to happen for that fair value to stack up? The narrative leans on steady revenue growth, firmer margins and a richer future earnings multiple. Want to see the exact earnings, revenue and valuation path behind that call?
Result: Fair Value of $134.71 (UNDERVALUED)
However, there are still clear swing factors to watch, including higher capital needs for large projects and the risk that regulators become less supportive on future returns.
Another View: Cash Flows Point in a Different Direction
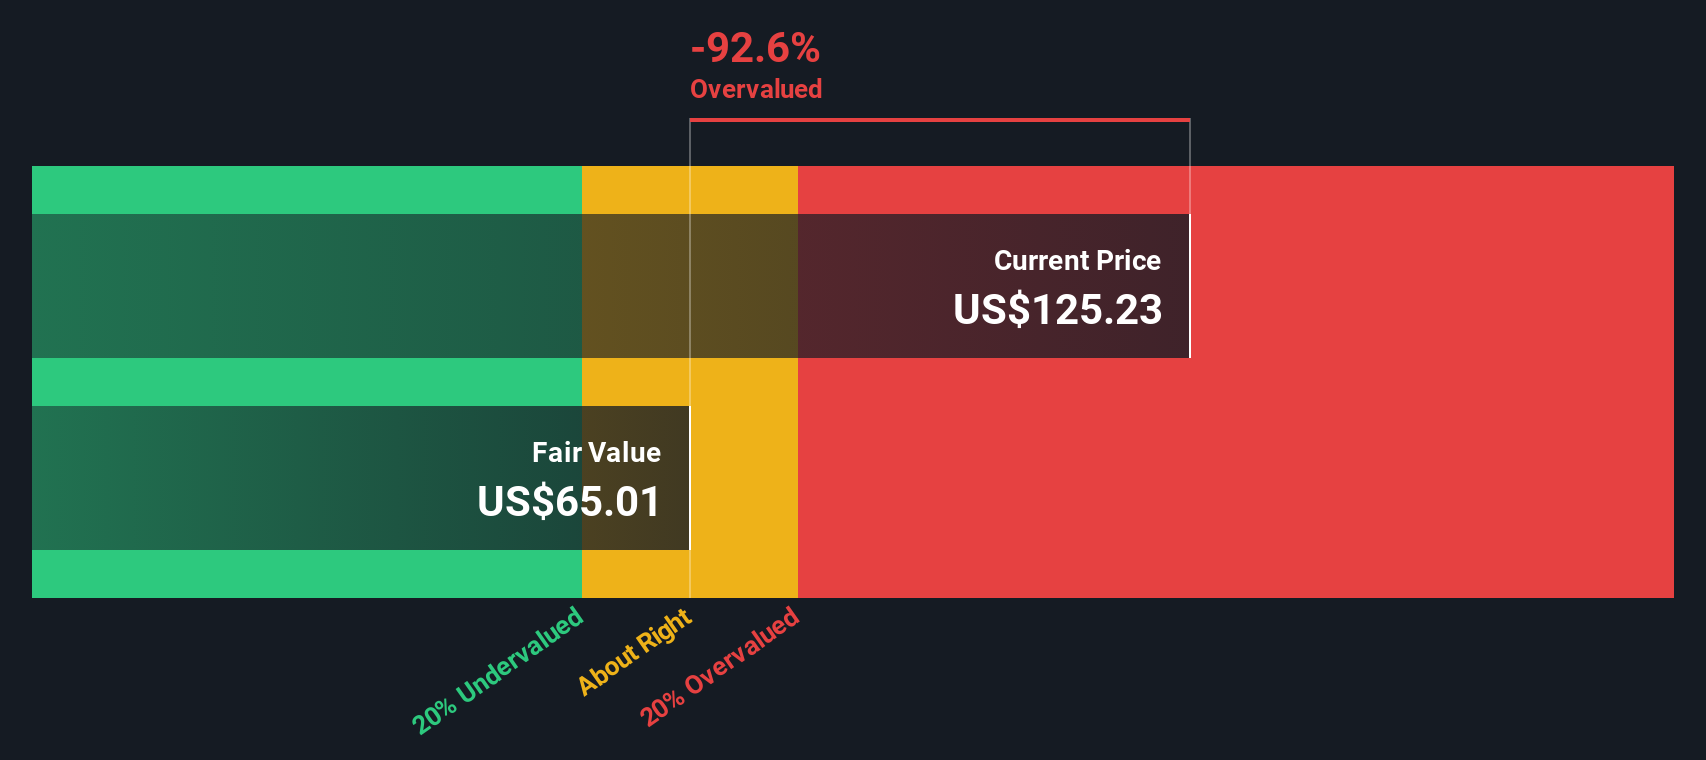
While the analyst narrative frames Duke Energy as about 4.8% undervalued at $128.20 versus a fair value near $134.71, our DCF model tells a much more cautious story. On that measure, the shares trade well above an estimated future cash flow value of $60.22. Which set of assumptions do you trust more: earnings and multiples, or long term cash flows?
Simply Wall St performs a discounted cash flow (DCF) on every stock in the world every day (check out Duke Energy for example). We show the entire calculation in full. You can track the result in your watchlist or portfolio and be alerted when this changes, or use our stock screener to discover 54 high quality undervalued stocks. If you save a screener we even alert you when new companies match - so you never miss a potential opportunity.
Build Your Own Duke Energy Narrative
If you look at the numbers and reach a different conclusion, or simply prefer to rely on your own work, you can build a custom view in just a few minutes, starting with Do it your way.
A great starting point for your Duke Energy research is our analysis highlighting 5 key rewards and 2 important warning signs that could impact your investment decision.
Ready for more investment ideas?
If you stop with just one stock, you might miss some of the most interesting opportunities on the platform. Keep stretching your ideas list while the market is moving.
- Spot potential bargains early by scanning our list of screener containing 24 high quality undiscovered gems that score well on quality and fundamentals.
- Strengthen your portfolio’s core with solid balance sheet and fundamentals stocks screener (44 results) that focus on companies with dependable financial footing.
- Target reliable income streams by reviewing 13 dividend fortresses that highlight higher yielding dividend payers.
This article by Simply Wall St is general in nature. We provide commentary based on historical data and analyst forecasts only using an unbiased methodology and our articles are not intended to be financial advice. It does not constitute a recommendation to buy or sell any stock, and does not take account of your objectives, or your financial situation. We aim to bring you long-term focused analysis driven by fundamental data. Note that our analysis may not factor in the latest price-sensitive company announcements or qualitative material. Simply Wall St has no position in any stocks mentioned.