A Look At Dyne Therapeutics (DYN) Valuation After New MAPT Blood Brain Barrier Data
Dyne Therapeutics Inc DYN | 0.00 |
Why this new MAPT data matters for Dyne Therapeutics stock
Dyne Therapeutics (DYN) is drawing fresh attention after reporting new preclinical data showing its FORCE platform crossing the blood brain barrier and achieving robust MAPT RNA knockdown in mice and nonhuman primates.
With detailed results set for the American Society of Gene & Cell Therapy 2026 meeting, this update puts a spotlight on how Dyne Therapeutics' CNS work might fit alongside its existing neuromuscular disease programs.
The new CNS data arrives after a mixed stretch for the stock, with a 7 day share price return of a 7.14% decline and a year to date share price return of a 5.14% decline. At the same time, the 1 year total shareholder return stands at 46.37%, suggesting earlier optimism around Dyne Therapeutics' pipeline has cooled recently while longer term holders have still seen meaningful gains.
If you are weighing this MAPT update against other potential ideas in health related technology, it could be worth scanning a curated set of healthcare focused AI names through the 33 healthcare AI stocks
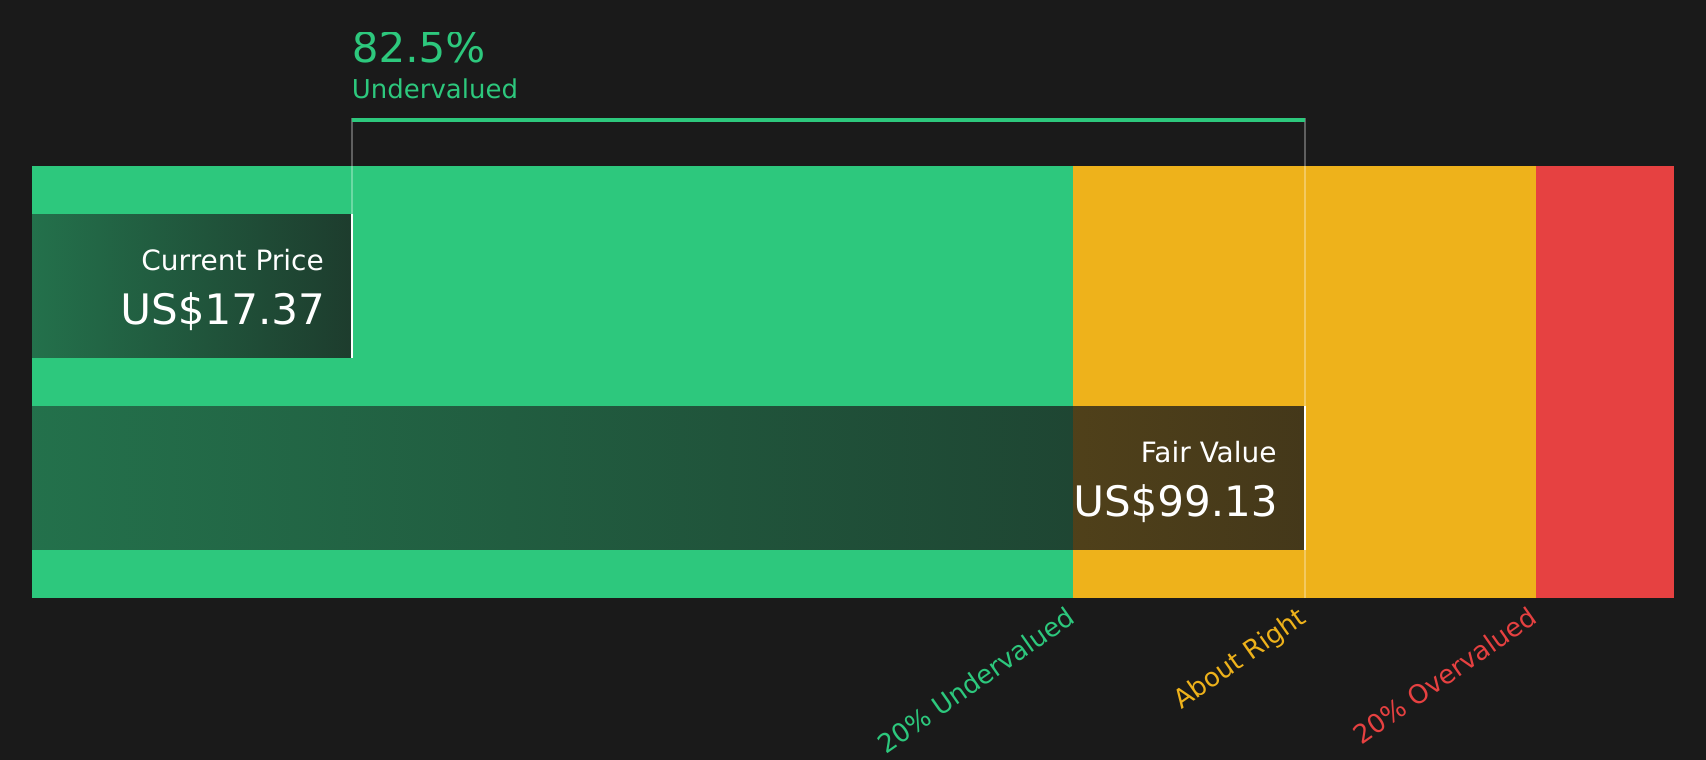
With Dyne still loss making and trading at US$17.55 against a US$3.9b market value and an implied discount to some intrinsic estimates, you need to ask whether this MAPT progress is underappreciated or already priced into future growth.
Price to book of 3x, is it justified?
Dyne Therapeutics trades at a P/B of 3x, which some investors may see as rich versus the US Biotechs peer average of 2.2x, even with the recent pullback to $17.55.
The P/B ratio compares the share price with the company’s net assets on the balance sheet. A higher figure often reflects expectations for future value creation rather than current earnings. For an early stage, loss making biotech like DYN, this typically means investors are placing weight on the potential of the pipeline and platform instead of near term profitability.
Relative to peers, paying 3x book value when the sector sits nearer 2.2x suggests the market is assigning a premium to Dyne Therapeutics, even though the company is unprofitable and is forecast to remain so over the next three years. The contrast with the SWS DCF view, which currently prices the shares at an 85.7% discount to an estimated future cash flow value of $122.69, underlines how wide the gap can be between balance sheet based and cash flow based signals.
Result: Price to book ratio of 3x (OVERVALUED).
However, you still need to factor in execution risk around Dyne’s loss making status, zero reported revenue, and the possibility that clinical or regulatory setbacks could reset expectations.
Another way to look at Dyne Therapeutics’ value
The P/B discussion paints DYN as expensive relative to the US Biotechs average of 2.2x, but the SWS DCF model tells a different story, with an estimated future cash flow value of $122.69 per share versus a current price of $17.55, implying the stock is heavily undervalued. Which signal do you trust more when a company has no revenue and is still loss making?
Simply Wall St performs a discounted cash flow (DCF) on every stock in the world every day (check out Dyne Therapeutics for example). We show the entire calculation in full. You can track the result in your watchlist or portfolio and be alerted when this changes, or use our stock screener to discover 51 high quality undervalued stocks. If you save a screener we even alert you when new companies match - so you never miss a potential opportunity.
Next Steps
Given the mixed signals around DYN, it makes sense to look closely at the full picture yourself and decide how comfortable you are with the trade off between risk and reward. You can start with the 1 key reward and 3 important warning signs.
Looking for more investment ideas?
If you want to balance this single stock view with other angles, use focused screeners to quickly spot opportunities that fit your style before they move away.
- Target long term compounding potential by scanning 51 high quality undervalued stocks that combine quality fundamentals with prices that look out of sync with underlying business strength.
- Prioritize resilience by reviewing 74 resilient stocks with low risk scores that stand out for steadier risk profiles, so sharp drawdowns in weaker names do not catch you off guard.
- Spot under the radar potential by checking the screener containing 25 high quality undiscovered gems that meet strict quality filters yet remain off many investors' radars.
This article by Simply Wall St is general in nature. We provide commentary based on historical data and analyst forecasts only using an unbiased methodology and our articles are not intended to be financial advice. It does not constitute a recommendation to buy or sell any stock, and does not take account of your objectives, or your financial situation. We aim to bring you long-term focused analysis driven by fundamental data. Note that our analysis may not factor in the latest price-sensitive company announcements or qualitative material. Simply Wall St has no position in any stocks mentioned.