A Look At EastGroup Properties (EGP) Valuation After Strong 2025 Results And Fresh 2026 Guidance
EastGroup Properties, Inc. EGP | 188.41 | +0.56% |
EastGroup Properties (EGP) shares moved after the company released fourth quarter and full year 2025 results, along with fresh 2026 guidance, giving investors updated visibility on earnings, revenue and per share performance.
The latest results and 2026 guidance have arrived after a steady run in the share price, with a 6.00% 90 day share price return and a 57.35% five year total shareholder return suggesting momentum has been building over time.
If this update has you thinking more broadly about real asset exposure, it could be a good moment to scan our screener for 25 power grid technology and infrastructure stocks as another way to look at infrastructure linked opportunities.
With EastGroup trading at $190.92, about 5.9% below the average analyst price target and at an estimated 13.8% discount to intrinsic value, the question is whether there is still a buying opportunity here or whether the market has already priced in future growth.
Most Popular Narrative: 4.8% Undervalued
With EastGroup Properties closing at $190.92 against a narrative fair value of about $200.63, the current setup hinges on how future cash flows are expected to play out under a roughly 8.6% discount rate.
Analysts are assuming EastGroup Properties's revenue will grow by 10.8% annually over the next 3 years. Analysts assume that profit margins will increase from 34.9% today to 36.9% in 3 years time.
Curious what kind of earnings power those revenue and margin assumptions imply, and how rich the future profit multiple needs to be to back into that fair value? The full narrative lays out a detailed earnings path and a premium valuation hurdle that many investors usually associate with faster growth sectors.
Result: Fair Value of $200.63 (UNDERVALUED)
However, the story can shift quickly if tenant demand softens in key regions or if funding new projects becomes harder because of higher interest costs.
Another View: Rich Multiples Tell a Different Story
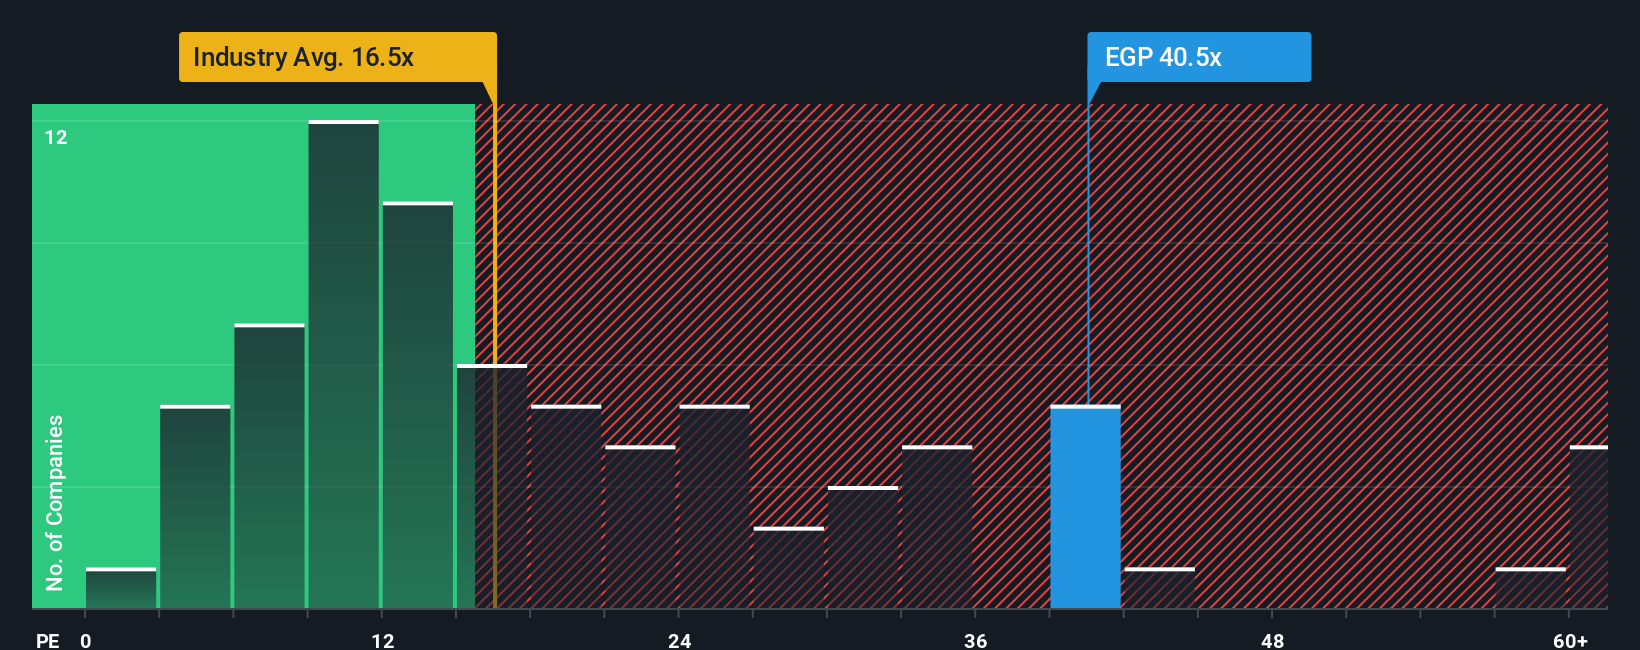
While the SWS DCF model points to EastGroup trading at a 13.8% discount to fair value, the simple P/E check paints a tighter picture. At 39.5x earnings, the shares sit well above both the peer average of 29.5x and the fair ratio of 34.6x. This suggests less room for error if growth or margins come in below expectations.
Build Your Own EastGroup Properties Narrative
If you look at these numbers and reach a different conclusion, or just want to stress test the assumptions yourself, you can build a personalised view in minutes with Do it your way.
A great starting point for your EastGroup Properties research is our analysis highlighting 4 key rewards and 1 important warning sign that could impact your investment decision.
Looking for more investment ideas?
If you stop with just one company, you could miss opportunities that fit your style even better, so take a moment to broaden your shortlist.
- Target dependable cash generators by scanning our list of 13 dividend fortresses that could appeal if you want income to play a bigger role in your portfolio.
- Hunt for potential value opportunities using our screener containing 24 high quality undiscovered gems, where you can spot companies that are not widely followed but still meet your quality checklist.
- Prioritise resilience first by reviewing the 83 resilient stocks with low risk scores, a focused way to see which companies our models flag with comparatively lower overall risk scores.
This article by Simply Wall St is general in nature. We provide commentary based on historical data and analyst forecasts only using an unbiased methodology and our articles are not intended to be financial advice. It does not constitute a recommendation to buy or sell any stock, and does not take account of your objectives, or your financial situation. We aim to bring you long-term focused analysis driven by fundamental data. Note that our analysis may not factor in the latest price-sensitive company announcements or qualitative material. Simply Wall St has no position in any stocks mentioned.