A Look At GeneDx Holdings (WGS) Valuation After Q1 2026 Reset And Securities Investigation
GeneDx Holdings Corp. Class A WGS | 0.00 |
GeneDx Holdings (WGS) has drawn attention after Q1 2026 results reported revenue of US$102.25 million, along with a significantly wider net loss and a reduced full-year revenue outlook.
The sharp reset in guidance and the securities investigation have coincided with pressure on GeneDx's stock, with the 30 day share price return down 38.22% and the year to date share price return down 69.20%. At the same time, the three year total shareholder return is very large, which suggests recent momentum has faded as investors reassess risk and future potential.
If you are reassessing high growth healthcare exposure after GeneDx's volatility, it might be a good time to widen your search and review 32 healthcare AI stocks
With revenue still growing, a wider loss, a sharp guidance cut and a securities investigation, the share price reset is stark. Is GeneDx now trading below its fundamentals, or is the market already pricing in future growth?
Most Popular Narrative: 72.6% Undervalued
GeneDx's most followed valuation narrative puts fair value at $148.89 per share against the last close of $40.75, a wide gap that reflects very different expectations from the current market price.
Rapid expansion into new and underpenetrated markets including general pediatrics, NICU, and additional pediatric specialties positions GeneDx for substantial future volume and revenue growth as adoption of genomics as a frontline diagnostic tool accelerates. Scaling proprietary AI powered genomic interpretation platforms and integrating newly acquired Fabric Genomics technology enhances efficiency and accuracy, which should both lower per sample costs and support margin expansion as the business grows.
Analysts are baking in faster revenue compounding, a shift from losses to sustained profitability, and a rich future earnings multiple to reach that fair value. Curious which growth and margin assumptions sit behind that gap to $148.89 and how they tie to coverage expansion and product roll out timing.
On Simply Wall St's numbers, that $148.89 fair value comes from discounting GeneDx's projected cash flows at a 6.98% rate, with the narrative expecting revenue and earnings to build over several years and eventually support a premium valuation multiple. That setup contrasts with the current market backdrop, where the stock has fallen 69.20% year to date and has a 1 year total return that trails both the US Healthcare sector and the broader US market, despite a very large 3 year total shareholder return.
GeneDx is still unprofitable on recent figures, reporting a net loss of $77.81m on revenue of $442.68m, and Simply Wall St's statement that the stock is trading 78.1% below its estimate of fair value and below its modelled future cash flow value of $185.73 suggests the valuation model is leaning heavily on those long term forecasts. At the same time, other indicators send mixed signals, including a value score of 3 out of 6, a P/S ratio that screens as expensive relative to both peers and the US Healthcare industry average, and high share price volatility over the past 3 months.
Investors weighing this setup may want to compare the narrative fair value and discount rate assumptions to their own views on GeneDx's forecast 18.6% annual revenue growth, the path to profitability over the next 3 years and the level of sustained earnings multiple that feels realistic for a genomics testing company with an AI platform focus. It can also help to consider governance and capital structure factors such as significant insider selling over the past quarter, CEO compensation that is above the typical level for US companies of similar size while the company remains loss making, and reliance on higher risk funding sources after the recent $100m term loan.
Result: Fair Value of $148.89 (UNDERVALUED)
However, the narrative leans heavily on generous reimbursement and faster adoption, while higher healthcare cost controls or slower pediatric and NICU uptake could quickly challenge those assumptions.
Another View: Market Pricing Vs Peer Metrics
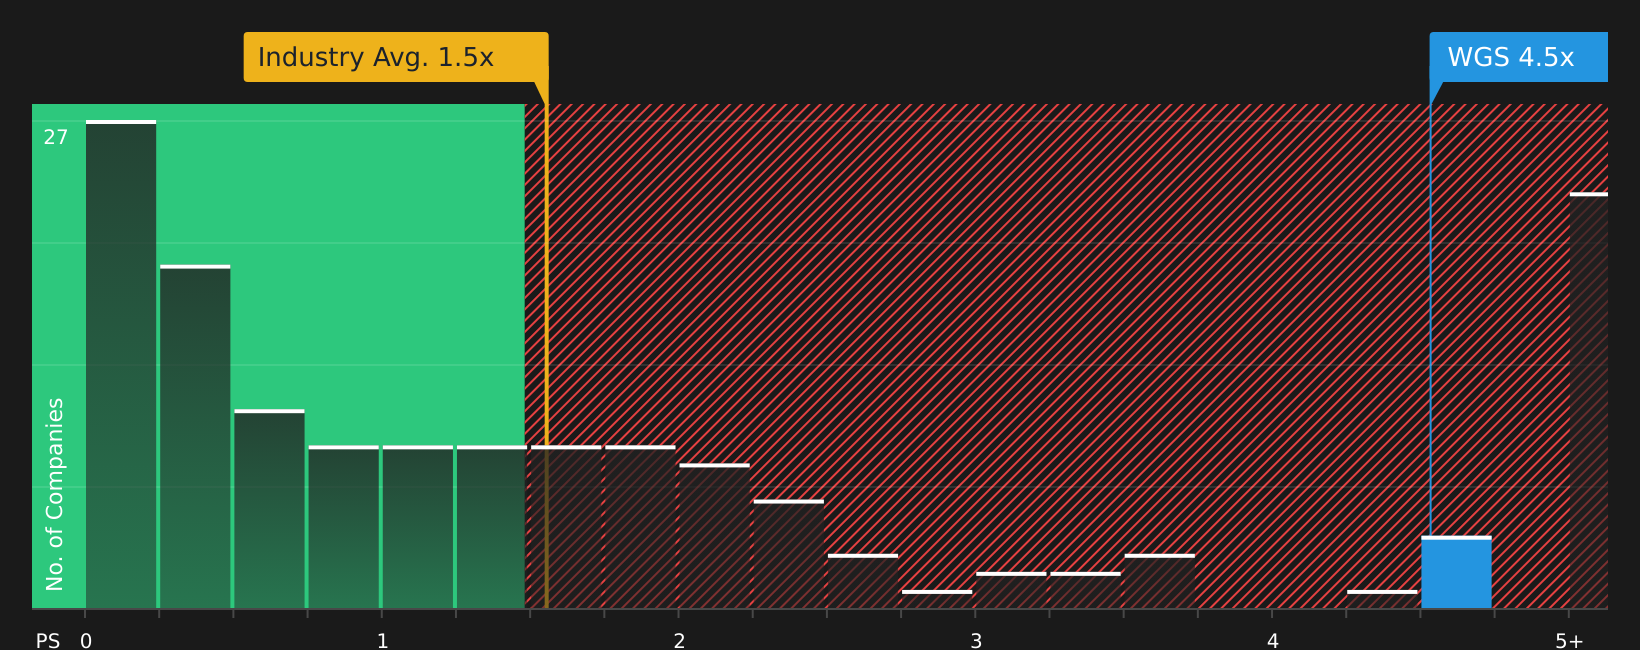
That 72.6% DCF style discount sits beside a mixed message from simple market ratios. GeneDx trades on a P/S of 2.7x, compared with 1.6x for peers and 1.2x for the wider US Healthcare sector, yet still below a fair ratio of 3.9x. Is this a margin of safety or a premium with strings attached?
Before leaning on any single ratio, it can help to stress test how comfortable you are with paying above sector P/S levels while the company is still loss making. It may also be useful to consider whether your expectations for growth and profitability justify that gap to the fair ratio. See what the numbers say about this price — find out in our valuation breakdown.
Next Steps
With sentiment clearly split between risk and opportunity, this is a moment to act quickly, review the data yourself, and weigh both sides. To balance the concerns around downside with the potential upside case, take a closer look at the 2 key rewards and 2 important warning signs
Looking for more investment ideas?
If GeneDx has you rethinking your watchlist, this can be a useful moment to widen your scope and line up fresh ideas before the next move.
- Spot potential mispricings early and scan 51 high quality undervalued stocks that combine strong fundamentals with attractive valuations.
- Prioritise resilience and review 65 resilient stocks with low risk scores that score well on financial strength and business stability.
- Get ahead of the crowd by checking the screener containing 21 high quality undiscovered gems that still fly under most investors' radar.
This article by Simply Wall St is general in nature. We provide commentary based on historical data and analyst forecasts only using an unbiased methodology and our articles are not intended to be financial advice. It does not constitute a recommendation to buy or sell any stock, and does not take account of your objectives, or your financial situation. We aim to bring you long-term focused analysis driven by fundamental data. Note that our analysis may not factor in the latest price-sensitive company announcements or qualitative material. Simply Wall St has no position in any stocks mentioned.