A Look At G‑III Apparel Group (GIII) Valuation After Dividend Move And Higher Fiscal 2026 Guidance
G-III Apparel Group, Ltd. GIII | 28.00 | +1.23% |
G-III Apparel Group (GIII) is back on investors’ radar after approving a quarterly dividend of US$0.10 per share and raising its fiscal 2026 earnings guidance following stronger-than-expected third quarter results.
The dividend decision and upgraded fiscal 2026 guidance come as the share price trades at US$29.35, with a 9.03% 90 day share price return and a 77.69% three year total shareholder return. This suggests momentum has picked up recently after a weaker one year total shareholder return.
If this kind of turnaround story has your attention, it could be a good moment to scan fast growing stocks with high insider ownership as a way to spot other potential growth and ownership aligned ideas.
With the stock at US$29.35, a 1 year total return close to flat and a three year return near 78%, the key question now is simple: is G III still mispriced or is the market already baking in future growth?
Preferred P/E of 8.4x: Is it justified?
On a P/E of 8.4x at a share price of $29.35, G III screens as cheaper than both the broader US market and the US Luxury peer group.
The P/E ratio links what you pay for each share to the company’s earnings. This is particularly relevant for a branded apparel group that already reports positive net income. With earnings growing by 10.1% per year over the past 5 years, but recording a 14.7% earnings decline over the last year and profit margins easing from 5.6% to 4.9%, the current multiple may reflect the mixed recent trend rather than a purely growth focused view.
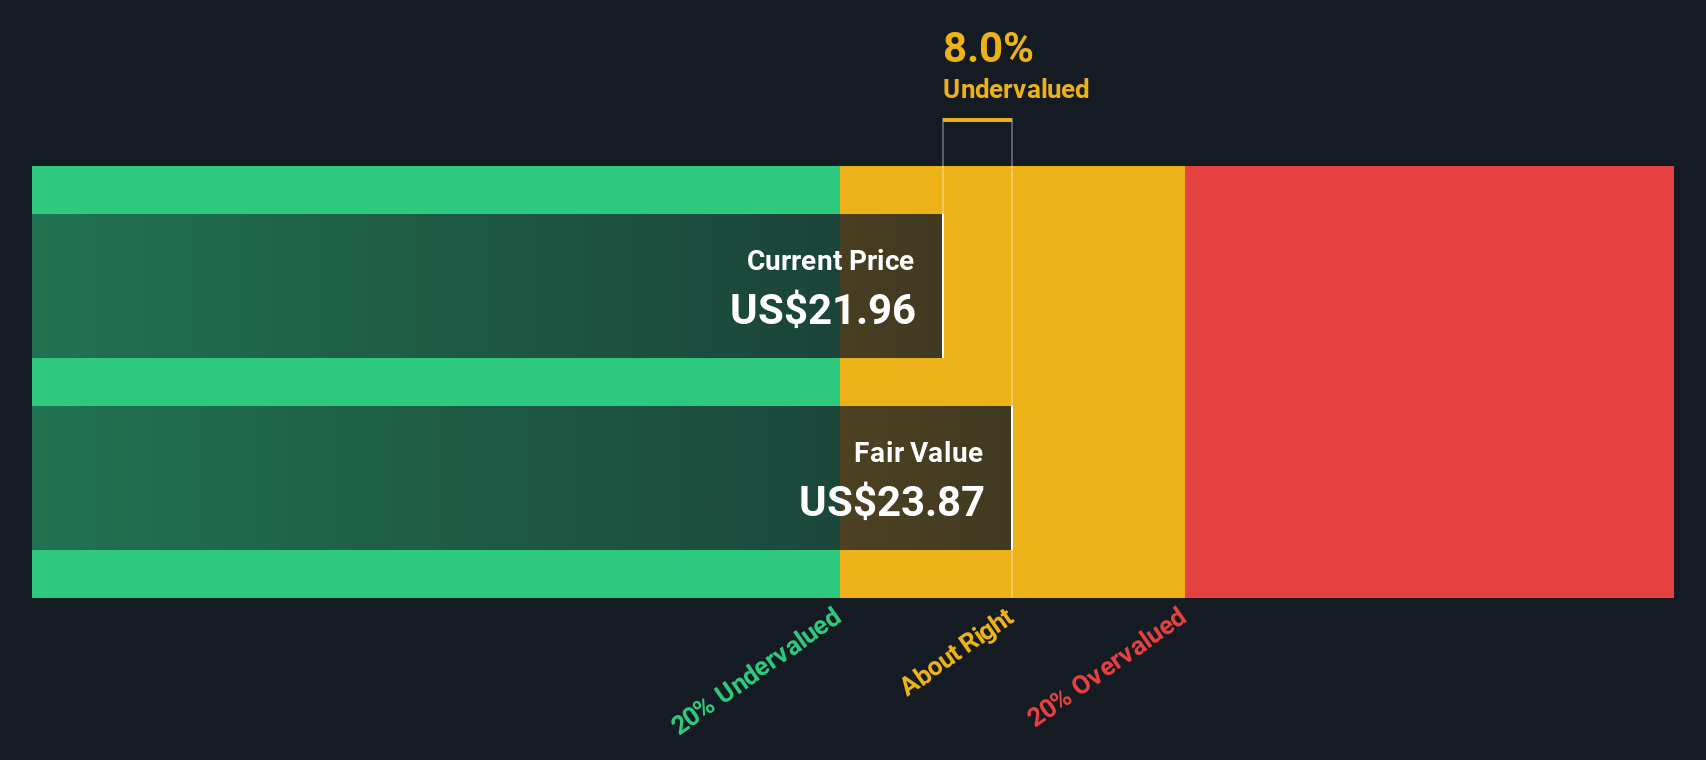
Relative comparisons are striking. G III trades on a P/E of 8.4x compared with the US market at 19.2x and the US Luxury industry at 18.2x, which is a sizeable discount in both cases. At the same time, the SWS DCF model currently suggests a future cash flow value of $19.06 per share, with the stock trading above that level at $29.35. In other words, the earnings based picture and the cash flow based estimate are pointing in different directions.
Result: Price to earnings of 8.4x (ABOUT RIGHT)
However, a 5.6% annual revenue decline and the share price trading above the SWS DCF estimate of US$19.06 could challenge the current recovery story.
Another View: DCF Points the Other Way
The low 8.4x P/E suggests G III looks inexpensive against the US market and Luxury peers, but our DCF model tells a different story. With the SWS DCF model indicating a future cash flow value of $19.06 per share versus the current $29.35, the stock screens as overvalued on this method. Which lens do you put more weight on: current earnings or long term cash flows?
Simply Wall St performs a discounted cash flow (DCF) on every stock in the world every day (check out G-III Apparel Group for example). We show the entire calculation in full. You can track the result in your watchlist or portfolio and be alerted when this changes, or use our stock screener to discover 886 undervalued stocks based on their cash flows. If you save a screener we even alert you when new companies match - so you never miss a potential opportunity.
Build Your Own G-III Apparel Group Narrative
If you see the numbers differently or prefer to work from your own assumptions, you can build a custom view of G III in just a few minutes, starting with Do it your way.
A great starting point for your G-III Apparel Group research is our analysis highlighting 1 key reward and 1 important warning sign that could impact your investment decision.
Looking for more investment ideas?
If G-III has sharpened your focus, do not stop here. Use the Simply Wall St Screener to uncover other opportunities that might fit your style and goals.
- Spot potential bargains with strong cash flow support by checking out these 886 undervalued stocks based on cash flows that may line up with your return expectations.
- Ride structural shifts in technology by scanning these 24 AI penny stocks that are tied to artificial intelligence themes.
- Strengthen your income watchlist by reviewing these 12 dividend stocks with yields > 3% that offer yields above 3%.
This article by Simply Wall St is general in nature. We provide commentary based on historical data and analyst forecasts only using an unbiased methodology and our articles are not intended to be financial advice. It does not constitute a recommendation to buy or sell any stock, and does not take account of your objectives, or your financial situation. We aim to bring you long-term focused analysis driven by fundamental data. Note that our analysis may not factor in the latest price-sensitive company announcements or qualitative material. Simply Wall St has no position in any stocks mentioned.