A Look At H.B. Fuller (FUL) Valuation As Returns On Capital And Reinvestment Improve
H.B. Fuller Company FUL | 60.51 | -3.15% |
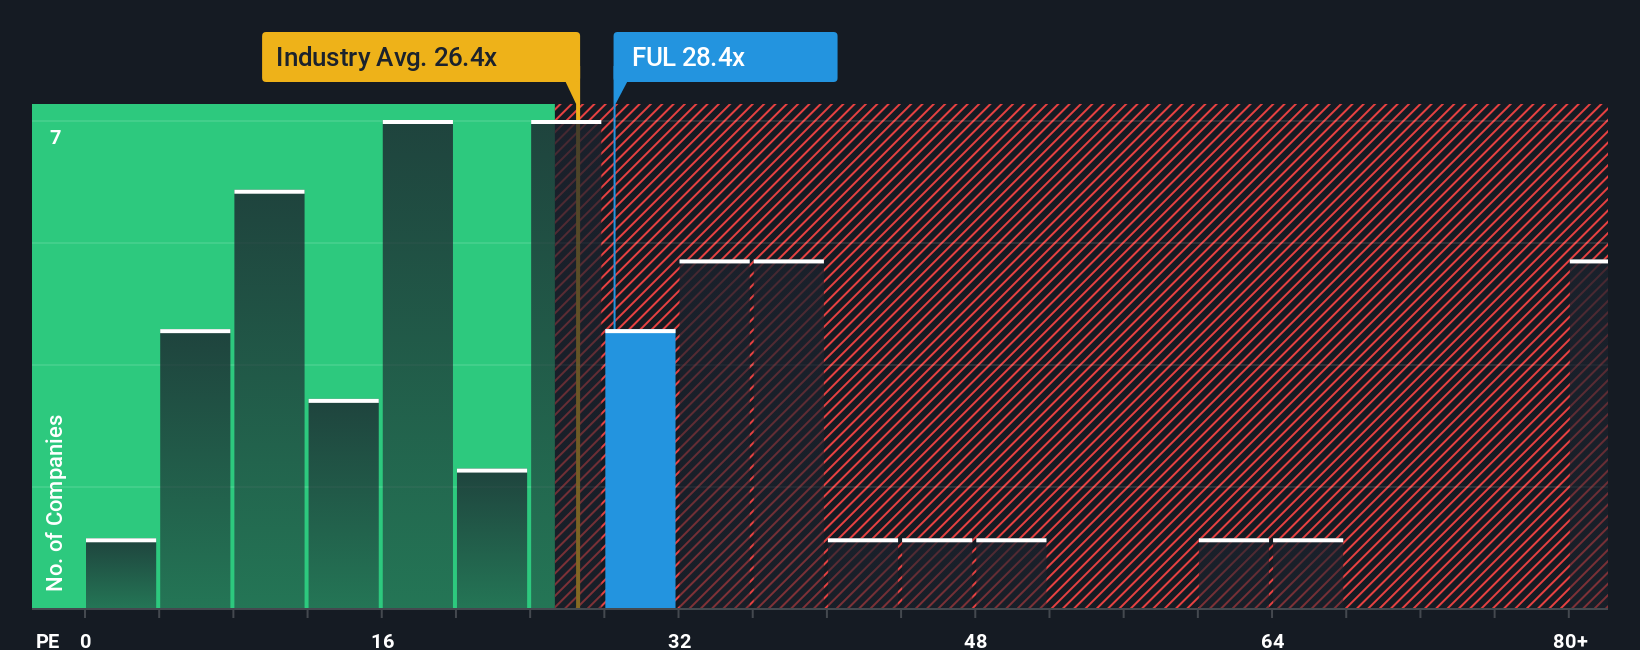
Why H.B. Fuller (FUL) is back on investor radars
Fresh analysis of H.B. Fuller (FUL), highlighting a 5 year rise in return on capital employed to 8.3% and a 27% increase in capital employed, is drawing attention to the company’s reinvestment profile.
The recent focus on H.B. Fuller’s reinvestment record comes as the shares trade at $65.48, with a 90 day share price return of 12.94% and a 1 year total shareholder return of 8.57%. The 3 year total shareholder return shows an 8.28% decline, which contrasts with a 31.19% gain over five years and hints that momentum has picked up again after a softer period.
If you are comparing H.B. Fuller with other materials and industrial names, it can also be worth widening the lens to spot patterns in ownership and growth. If you're considering what else is moving in the market, now is a good time to broaden your investing horizons with fast growing stocks with high insider ownership
With the shares near $65.48, a small discount to the $68.57 analyst target and an intrinsic value estimate that is slightly above market, the real question is whether H.B. Fuller is still mispriced or if the market is already incorporating expectations for future growth.
Most Popular Narrative: 4.9% Undervalued
Against the last close of $65.48, the most followed narrative points to a fair value near $68.83, built on detailed earnings and margin assumptions.
The company's strategic initiatives, such as optimizing the portfolio mix and streamlining the manufacturing cost structure, aim to drive the business toward a greater than 20% EBITDA margin target, potentially enhancing profitability and earnings. H.B. Fuller's efforts in leveraging its unique operating model to reduce exposure to currency fluctuations and tariffs are designed to maintain a competitive edge and support margin expansion, which can improve net margins and financial stability.
Curious how modest revenue growth, a step change in profit margins, and a lower future P/E all fit together into that valuation? The full narrative lays out the earnings bridge, the margin reset, and the implied multiple in a way the headline numbers alone do not.
Result: Fair Value of $68.83 (UNDERVALUED)
However, that story can change quickly if weak demand, pressure in the solar segment, and raw material costs continue to squeeze EBITDA and delay the planned margin improvement.
Another Angle on Valuation
That 4.9% undervaluation story sits awkwardly next to the current P/E of 30.8x, which is higher than both the US Chemicals industry at 25.6x and peers at 30.2x. Our fair ratio of 24.9x suggests less headroom and more valuation risk if earnings or sentiment wobble.
Build Your Own H.B. Fuller Narrative
If you see the numbers differently or want to stress test your own assumptions, you can build a custom view of H.B. Fuller in minutes by starting with Do it your way.
A great starting point for your H.B. Fuller research is our analysis highlighting 2 key rewards and 3 important warning signs that could impact your investment decision.
Looking for more investment ideas?
If H.B. Fuller has you thinking about what else could be worth your attention, it makes sense to cast a wider net before you settle on your next move.
- Spot potential mispricings early by scanning these 882 undervalued stocks based on cash flows that align with strong cash flow profiles and more attractive entry points.
- Back big themes in technology and automation by reviewing these 28 AI penny stocks that are tied to data, software, and machine learning adoption across industries.
- Lean into income-focused ideas with these 12 dividend stocks with yields > 3% that can help you build a more resilient, cash generating portfolio.
This article by Simply Wall St is general in nature. We provide commentary based on historical data and analyst forecasts only using an unbiased methodology and our articles are not intended to be financial advice. It does not constitute a recommendation to buy or sell any stock, and does not take account of your objectives, or your financial situation. We aim to bring you long-term focused analysis driven by fundamental data. Note that our analysis may not factor in the latest price-sensitive company announcements or qualitative material. Simply Wall St has no position in any stocks mentioned.