A Look At HealthEquity (HQY) Valuation After Updated 2027 Revenue Guidance
HealthEquity Inc HQY | 84.67 | +1.55% |
HealthEquity (HQY) set fresh expectations for investors by issuing revenue guidance for the fiscal year ending January 31, 2027, projecting US$1.38b to US$1.41b, shortly before presenting at the J.P. Morgan Healthcare Conference.
At a share price of US$84.0, HealthEquity’s recent guidance and conference appearance come after a 30 day share price return of a 12% decline and a 1 year total shareholder return of a 19.8% decline. However, the 3 year total shareholder return of 47.03% points to a stronger longer term journey where current momentum looks to be fading.
If this kind of healthcare story is on your radar, it could be a good moment to scan other opportunities across healthcare stocks and see what stands out next.
With shares at US$84.0 and recent guidance pointing to US$1.38b to US$1.41b in revenue, the big question is whether recent weakness leaves HealthEquity undervalued or if the market is already pricing in future growth.
Most Popular Narrative: 30.1% Undervalued
Against a last close of US$84.0, the most followed narrative pegs HealthEquity's fair value at about US$120.19. This implies a sizeable valuation gap built on specific growth, margin, and discount rate assumptions.
The analysts have a consensus price target of $122.357 for HealthEquity based on their expectations of its future earnings growth, profit margins and other risk factors. However, there is a degree of disagreement amongst analysts, with the most bullish reporting a price target of $134.0, and the most bearish reporting a price target of just $108.0.
Curious what supports that valuation gap? Earnings, revenue, margins, and a future P/E multiple are all baked into this model. Want to see how each piece fits together?
The narrative framework uses a 6.96% discount rate and layers in expectations for steady revenue growth, higher profit margins, and a lower future P/E multiple than today to bridge from current earnings to that implied fair value. It effectively asks whether you agree that HealthEquity can grow into those earnings and margin assumptions while still supporting a premium earnings multiple compared to the broader US healthcare group.
Result: Fair Value of $120.19 (UNDERVALUED)
However, the whole story starts to wobble if HSA account growth slows in a weaker labor market, or if lower interest rates squeeze earnings from custodial cash.
Another View: Earnings Multiple Sends a Different Signal
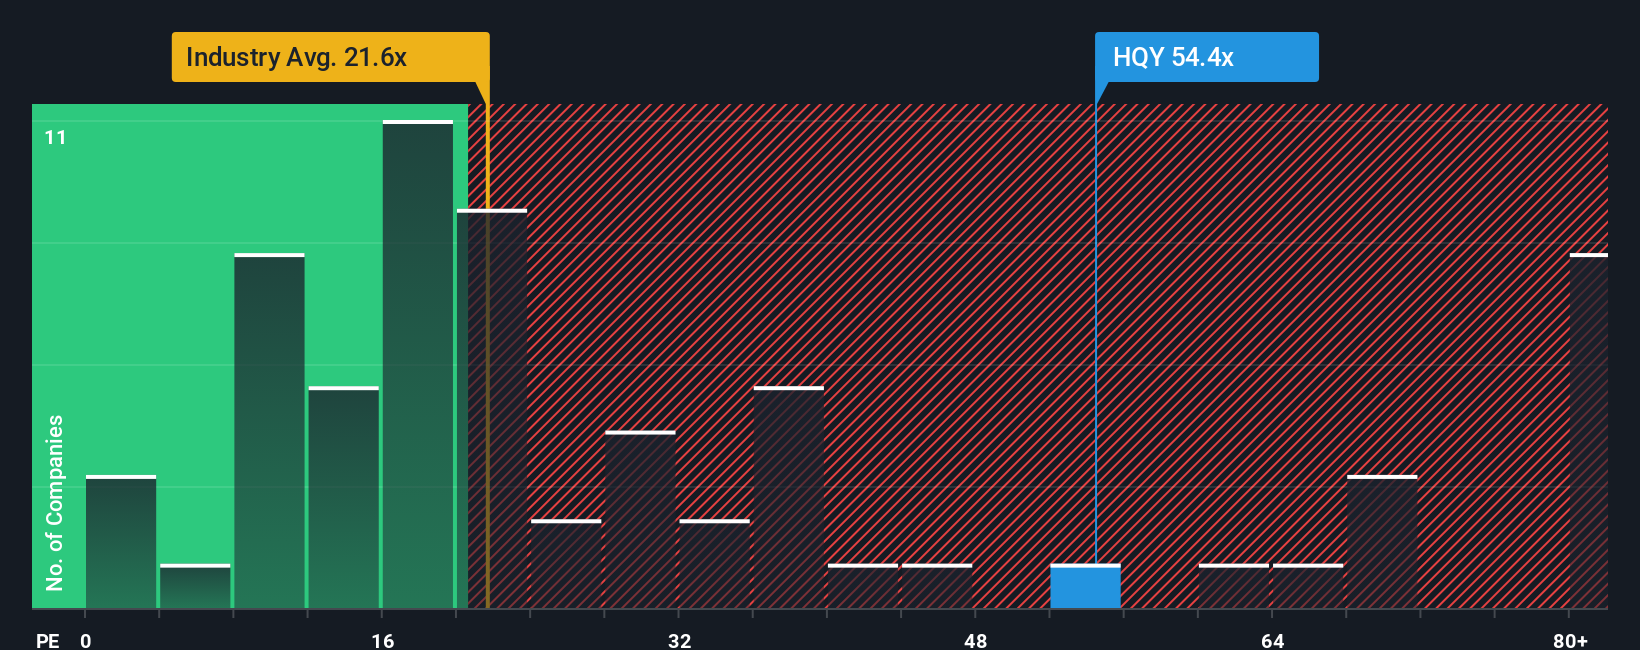
That 30.1% undervalued narrative sits awkwardly alongside HealthEquity’s current P/E of 37.4x, which is much higher than both the US healthcare industry average of 23.5x and the peer average of 22.4x, and above a fair ratio of 27.2x that the market could move towards.
In practice, that gap suggests less room for error if profit growth or margins underperform expectations, even if long term HSA themes stay intact. Do you see this as a premium worth paying, or a sign to be more cautious about how much future success is already in the price?
Build Your Own HealthEquity Narrative
If you are not fully convinced by these viewpoints or would prefer to rely on your own research and assumptions, you can reconstruct the story yourself in just a few minutes, starting with Do it your way.
A great starting point for your HealthEquity research is our analysis highlighting 4 key rewards and 1 important warning sign that could impact your investment decision.
Ready for more stock ideas?
If HealthEquity has you thinking harder about where you put your money next, do not stop here. Put a shortlist together now so you are not reacting later.
- Target reliable cash flows by scanning these 13 dividend stocks with yields > 3% that may suit investors who want income as well as potential share price moves.
- Ride big-picture technology shifts by reviewing these 24 AI penny stocks that link artificial intelligence themes with higher growth potential.
- Hunt for mispriced opportunities by checking these 872 undervalued stocks based on cash flows that might still be flying under the radar.
This article by Simply Wall St is general in nature. We provide commentary based on historical data and analyst forecasts only using an unbiased methodology and our articles are not intended to be financial advice. It does not constitute a recommendation to buy or sell any stock, and does not take account of your objectives, or your financial situation. We aim to bring you long-term focused analysis driven by fundamental data. Note that our analysis may not factor in the latest price-sensitive company announcements or qualitative material. Simply Wall St has no position in any stocks mentioned.