

A Look At Huntington Bancshares (HBAN) Valuation As Short Term Performance Sends Mixed Signals
Huntington Bancshares Incorporated HBAN | 0.00 |
Recent performance snapshot for Huntington Bancshares stock
Huntington Bancshares (HBAN) has seen mixed share performance recently, with the stock up 0.6% over the past day and 1.7% over the past week, but down over the past month and past 3 months.
The recent dip in the 30 day and 90 day share price returns contrasts with Huntington Bancshares' 1 year total shareholder return of 6.5% and 3 year total shareholder return of 76.1%. This suggests that longer term momentum remains stronger than the short term trend.
If this kind of mixed performance has you thinking about diversification, it could be a good time to scan for other opportunities such as 21 top founder-led companies
With Huntington Bancshares trading at $16.12, sitting at a 52% intrinsic discount and about 23% below the average analyst price target, the key question is whether this gap signals a genuine opportunity or if the market already reflects its future growth.
Most Popular Narrative: 59% Overvalued
Compared with the last close at $16.12, the most followed narrative pegs Huntington Bancshares' fair value closer to $10.11, putting the market price well above that mark and setting up a clear valuation gap for investors to weigh.
The stock has been rated as a "Moderate Buy" by most analysts, with 12 out of 19 giving it a "Buy" or "Strong Buy" recommendation. The price targets range from a low of $13.50 to a high of $18.00, which implies a wide range of possible outcomes depending on market conditions.
Curious how a fair value around $10 builds into an overvaluation call at today’s price? The narrative leans heavily on earnings expectations and a future profit multiple that has to work hard to justify the gap between current trading levels and that fair value line.
Result: Fair Value of $10.11 (OVERVALUED)
However, earnings or margin pressure (given the 26% profit margin), or a shift in analyst sentiment around the future P/E of 11 could challenge this overvaluation case.
Another View: Cash Flows Paint a Different Picture
While some commentary suggests that Huntington Bancshares is trading about 59% above a fair value of $10.11, our DCF model indicates a different result. On this basis, the stock price of $16.12 is well below an estimated future cash flow value of $33.36, which highlights a different type of pricing risk for investors to consider.
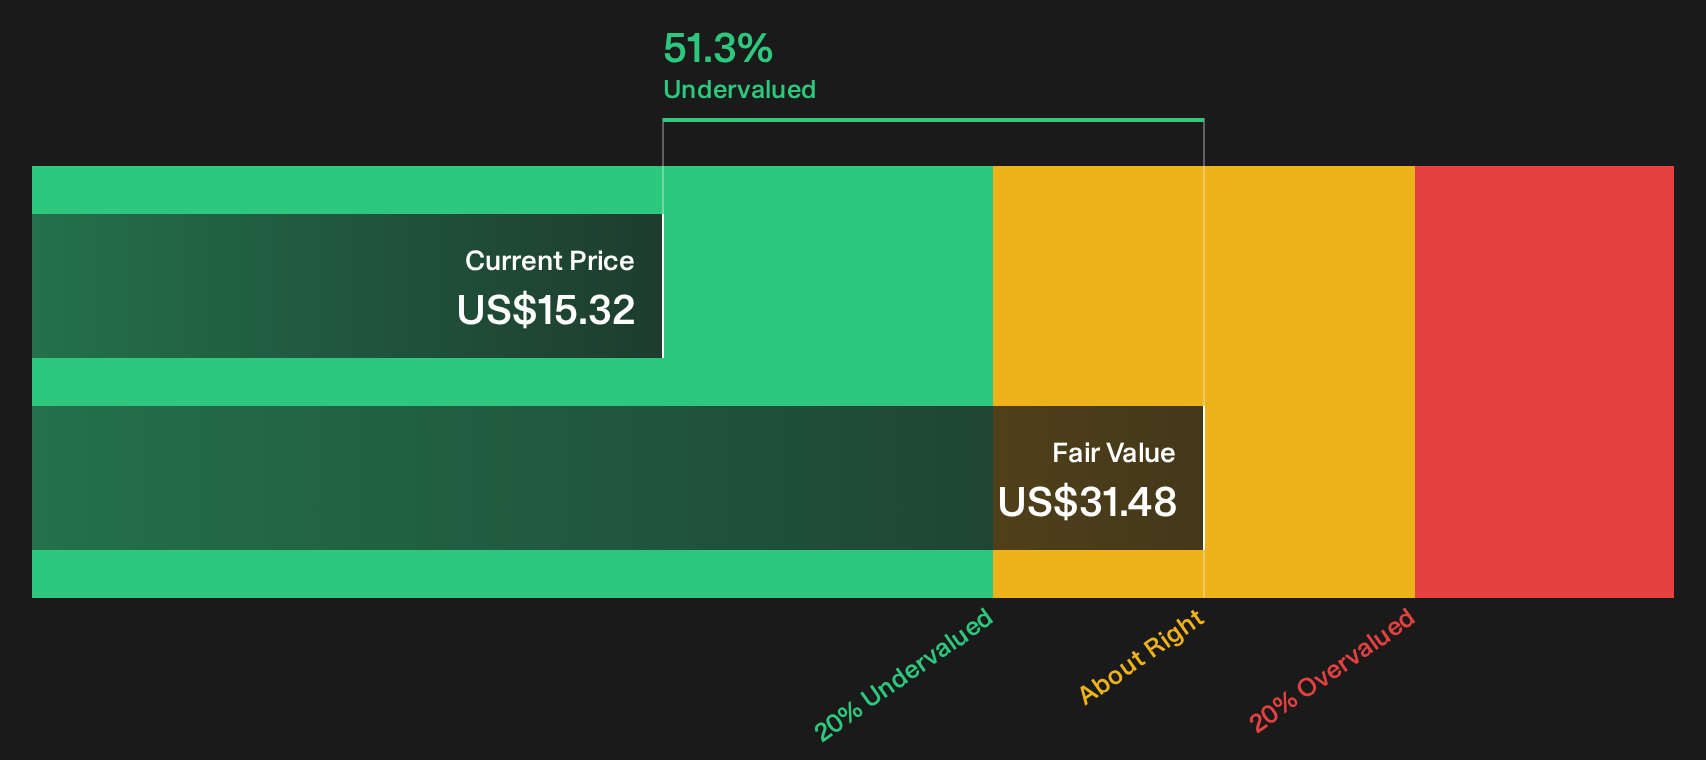
Simply Wall St performs a discounted cash flow (DCF) on every stock in the world every day (check out Huntington Bancshares for example). We show the entire calculation in full. You can track the result in your watchlist or portfolio and be alerted when this changes, or use our stock screener to discover 46 high quality undervalued stocks. If you save a screener we even alert you when new companies match - so you never miss a potential opportunity.
Next Steps
Seeing mixed signals in the story so far, it helps to review the underlying data yourself, weigh both sides, and move quickly to form your own stance using 5 key rewards and 1 important warning sign.
Looking for more investment ideas?
If Huntington Bancshares has sharpened your thinking, do not stop here. Use powerful screeners to uncover fresh stock ideas that could fit your portfolio goals.
- Zero in on value potential by reviewing companies flagged in the 46 high quality undervalued stocks for stronger fundamentals at appealing prices.
- Prioritise resilience by assessing stocks in the 64 resilient stocks with low risk scores with steadier profiles and lower overall risk scores.
- Spot early opportunities by scanning the screener containing 22 high quality undiscovered gems before they draw wider market attention.
This article by Simply Wall St is general in nature. We provide commentary based on historical data and analyst forecasts only using an unbiased methodology and our articles are not intended to be financial advice. It does not constitute a recommendation to buy or sell any stock, and does not take account of your objectives, or your financial situation. We aim to bring you long-term focused analysis driven by fundamental data. Note that our analysis may not factor in the latest price-sensitive company announcements or qualitative material. Simply Wall St has no position in any stocks mentioned.