A Look At Immunome (IMNM) Valuation After New Barclays Overweight Coverage
Immunome, Inc. IMNM | 0.00 |
Immunome (IMNM) drew fresh investor attention after Barclays began covering the stock with an Overweight rating, highlighting its antibody drug conjugate platform and broader oncology pipeline within the small and mid cap biotech space.
At a share price of US$21.83, Immunome has seen mixed recent share price returns, with modest gains year to date alongside a very large 1 year total shareholder return and a multi year total shareholder return above 3x. This suggests that momentum has broadly been building around its oncology pipeline and recent conference and coverage announcements.
If you are looking beyond Immunome and want to see what else is moving in cancer focused technology, take a look at our screener of 39 healthcare AI stocks
With the stock trading at a sizeable discount to the average analyst price target and an intrinsic value estimate suggesting further upside, the key question is whether Immunome is still mispriced or if the market is already assuming strong future growth.
Price to Book of 4.2x: Is it justified?
On a P/B of 4.2x, Immunome trades at a higher valuation than the broader US biotech industry average of 2.6x, yet below its closer peer group on 8.4x.
The P/B ratio compares the stock price with the accounting value of net assets. This can be a common yardstick for early stage or loss making biotechs where earnings are not yet a meaningful guide. A higher P/B often reflects the market assigning more value to a company’s pipeline, intellectual property or future revenue potential than its current balance sheet would suggest.
For Immunome, the stock is more expensive than the wider US biotech industry on this metric. This points to stronger expectations being priced in than for the average company. However, the P/B is lower than the peer average. This suggests that, relative to a closer group of comparable biotechs, the market is assigning a more moderate premium to Immunome’s assets and oncology programs.
Result: Price-to-book of 4.2x (ABOUT RIGHT)
However, recent share price pullbacks over 1 day, 30 days and 90 days, together with ongoing net losses of US$224.593 million, could quickly test that optimism.
Another View: What Does The SWS DCF Model Say?
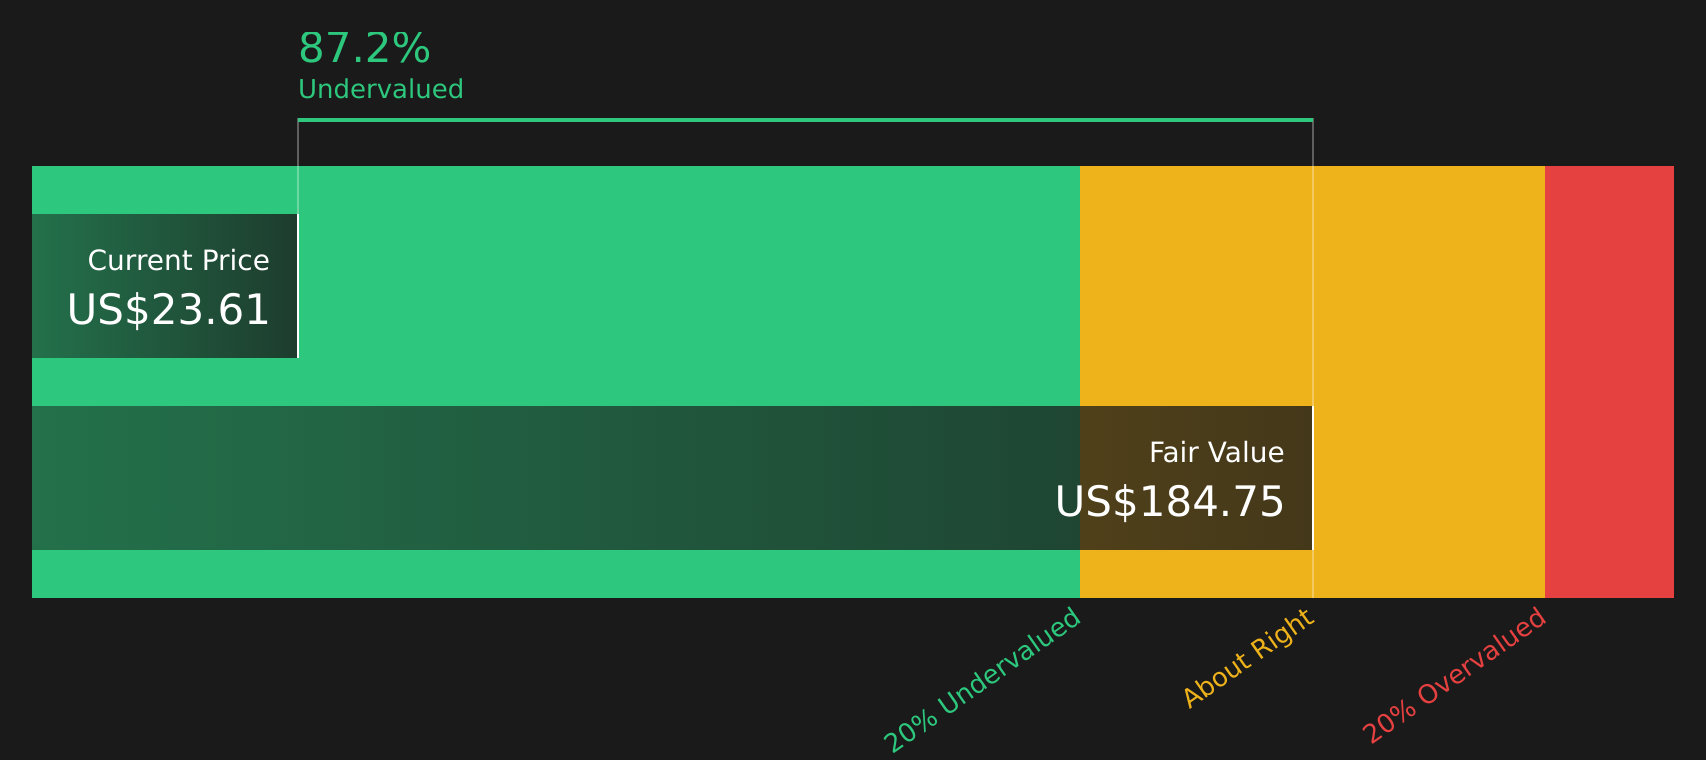
While the P/B of 4.2x sits above the broader biotech average, the SWS DCF model points in a very different direction. At a share price of $21.83, Immunome is trading about 85.9% below an estimated future cash flow value of $154.39. That gap raises a clear question: is the market being too cautious about long term cash generation?
Simply Wall St performs a discounted cash flow (DCF) on every stock in the world every day (check out Immunome for example). We show the entire calculation in full. You can track the result in your watchlist or portfolio and be alerted when this changes, or use our stock screener to discover 46 high quality undervalued stocks. If you save a screener we even alert you when new companies match - so you never miss a potential opportunity.
Next Steps
Mixed signals on valuation and sentiment can be hard to interpret, so it makes sense to review the data yourself and decide how comfortable you are with the balance between potential and risk. To help you weigh both sides in one place, take a closer look at the 3 key rewards and 4 important warning signs.
Looking for more investment ideas?
If Immunome has caught your eye, do not stop here. Use the tools available to spot other opportunities before they move beyond your comfort zone.
- Target potential upside by scanning for companies that look mispriced on fundamentals with the help of 46 high quality undervalued stocks.
- Protect your capital by focusing on companies with healthier finances using the solid balance sheet and fundamentals stocks screener (46 results).
- Get ahead of the crowd by spotting underfollowed opportunities through the screener containing 22 high quality undiscovered gems.
This article by Simply Wall St is general in nature. We provide commentary based on historical data and analyst forecasts only using an unbiased methodology and our articles are not intended to be financial advice. It does not constitute a recommendation to buy or sell any stock, and does not take account of your objectives, or your financial situation. We aim to bring you long-term focused analysis driven by fundamental data. Note that our analysis may not factor in the latest price-sensitive company announcements or qualitative material. Simply Wall St has no position in any stocks mentioned.