

A Look At Intuitive Surgical (ISRG) Valuation After Strong Q1 Beat And Raised Procedure Growth Outlook
Intuitive Surgical, Inc. ISRG | 0.00 |
Intuitive Surgical (ISRG) is back in focus after first quarter results topped earnings and revenue forecasts, da Vinci procedure growth guidance was lifted, and fresh upgrades to its robotic surgery ecosystem were outlined.
The share price has been under pressure with a year to date share price return down 22.04%, although the 3 year total shareholder return of 42.75% and 5 year total shareholder return of 56.06% show longer term holders have still seen gains.
If Intuitive Surgical’s recent move has you looking at other healthcare automation opportunities, this is a good moment to scan the 35 robotics and automation stocks.
With the stock down sharply over the past year yet carrying upbeat analyst targets and solid recent execution, the key question now is simple: Is Intuitive Surgical on sale, or is the market already pricing in years of future growth?
Most Popular Narrative: 18% Undervalued
According to the most followed Simply Wall St narrative, Intuitive Surgical’s fair value of $532.46 sits above the last close at $438.10, which frames the stock as trading below that narrative estimate while analysts also see upside from current levels.
Over the next 5 years I calculate with (actual values from 18.01.26, price/shr at 533 USD): Revenue Growth p.a.: 12% (Currently at 14,7%). We saw the peak of revenue growth with nearly 15%. Now even 12% is ambitious, but with the “subscription-like” revenues from spare parts and software licences, based on a still growing base of installed systems, it appears realistic. Profit Margin: 30% (currently at 28,6%) because spare parts in general have more margin than system sales, and the sales out of spare parts is still growing. Future PE: 50 (currently at 69). The high PEs are typical for fast growers, but over time the PE will go down. I see for the next 5 years 50, in 10 years it could come down to 40. Interest rate: 6,77% (same as current). This leads to an FV of 533 USD, which means ISRG trades with 0,5% at fair value.
Want to see what sits behind that fair value number? The narrative leans on steady revenue expansion, firming margins and a still rich profit multiple. Curious how those moving parts combine into a single valuation call?
Result: Fair Value of $532.46 (UNDERVALUED)
However, that fair value story could be challenged if procedure growth slows meaningfully or if hospitals delay system upgrades and service contracts more than expected.
Another View: High Multiple Signals Caution
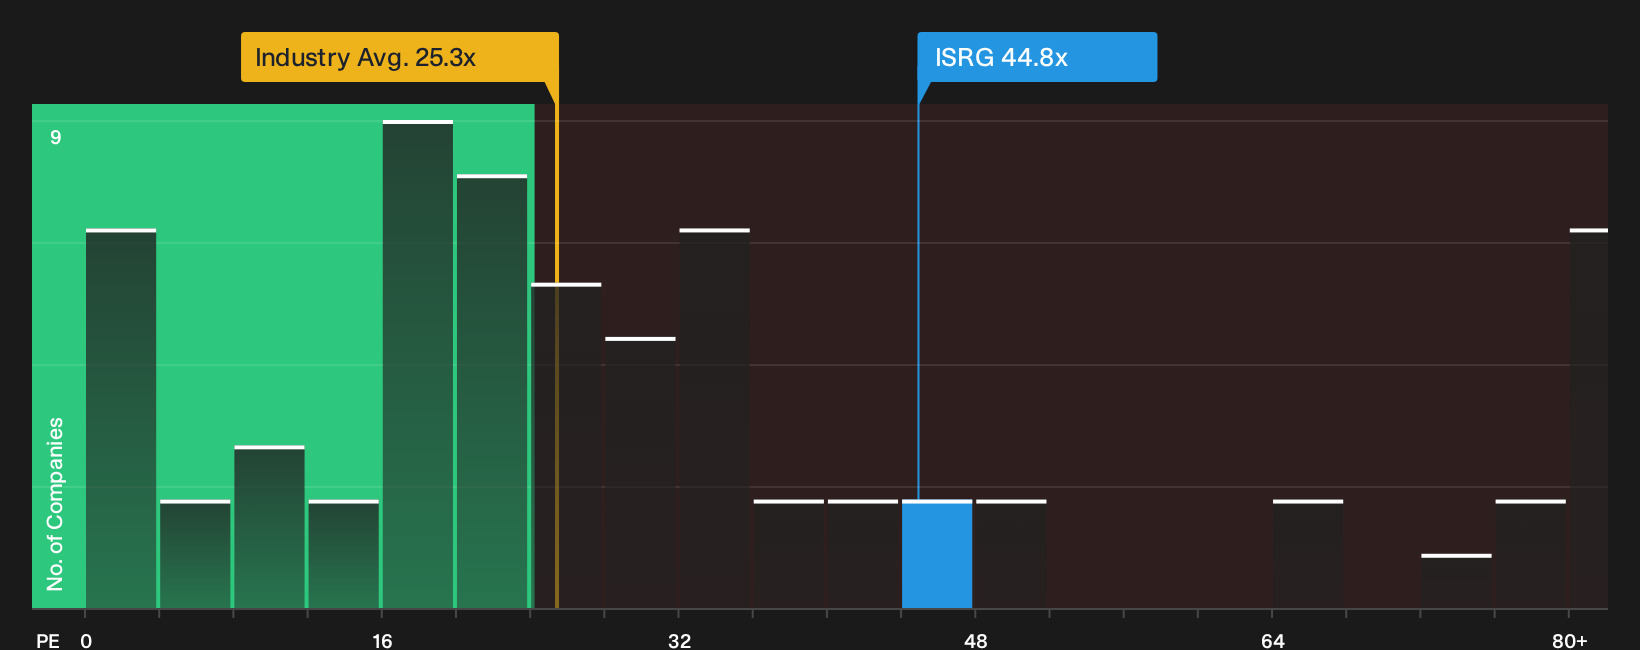
The popular fair value narrative paints Intuitive Surgical as 18% undervalued, but the market’s own pricing tells a different story. At a P/E of 52.1x versus 24.5x for the US Medical Equipment industry, 26.7x for peers, and a fair ratio of 32.2x, the stock is priced at a clear premium. That gap can reflect quality, but it also raises the risk that even solid execution might not be enough if expectations cool.
For investors weighing how much this premium matters day to day, our valuation breakdown goes deeper into why the current P/E sits so far above the fair ratio and sector norms, and what that could mean if sentiment shifts. See what the numbers say about this price — find out in our valuation breakdown.
Next Steps
After weighing the bullish fair value story against that rich P/E, where do you land on the stock today? Act while the details are fresh and review the 3 key rewards
Looking for more investment ideas?
If Intuitive Surgical has sharpened your focus on quality, now is the time to broaden your watchlist with a few targeted stock ideas that fit your style.
- Target potential bargains by scanning 49 high quality undervalued stocks that pair strong fundamentals with prices that sit below their estimated worth.
- Build a steadier income stream by reviewing 10 dividend fortresses that aim to combine higher yields with resilience.
- Prioritize resilience first by checking 67 resilient stocks with low risk scores that score well on financial strength and risk metrics.
This article by Simply Wall St is general in nature. We provide commentary based on historical data and analyst forecasts only using an unbiased methodology and our articles are not intended to be financial advice. It does not constitute a recommendation to buy or sell any stock, and does not take account of your objectives, or your financial situation. We aim to bring you long-term focused analysis driven by fundamental data. Note that our analysis may not factor in the latest price-sensitive company announcements or qualitative material. Simply Wall St has no position in any stocks mentioned.