A Look At Jefferies Financial Group (JEF) Valuation After Bond Offering And UBS Upgrade
Jefferies Financial Group Inc. JEF | 41.67 | +0.75% |
Why Jefferies’ latest bond moves matter for stock investors
Jefferies Financial Group (JEF) has just completed a large fixed income offering, including US$1.5b of 5.500% senior notes due 2036. This provides the firm with fresh capital for general corporate purposes.
At the same time, an analyst upgrade from UBS, tied to expectations for higher returns on tangible equity, has pushed Jefferies back onto many investors’ radar as they reassess the stock’s risk and return profile.
Jefferies’ recent bond issuance and the UBS upgrade come at a time when the share price, at US$61.95, shows a 12.84% 90 day share price return but a 17.19% 1 year total shareholder return decline. However, longer term total shareholder returns over three and five years remain strong, which suggests sentiment has cooled recently even as the long run record still looks robust.
If Jefferies’ latest funding moves have you thinking about where capital could flow next, it might be a good moment to broaden your search with fast growing stocks with high insider ownership.
With Jefferies trading at US$61.95, sitting on a 12.84% 90 day gain but a 17.19% 1 year total return decline, and a roughly 20% discount to the average analyst target, is there still upside here, or has the market already priced in future growth?
Price-to-Earnings of 20.1x: Is it justified?
Jefferies is trading on a P/E of 20.1x at a share price of US$61.95, which sits below both peer and industry averages yet above its estimated fair P/E.
The P/E ratio links what you pay today to the earnings the company is currently producing. This tends to matter a lot for capital markets firms where profits can be cyclical and sensitive to deal activity.
In Jefferies’ case, a 20.1x P/E suggests investors are paying a higher multiple than the SWS fair P/E estimate of 18.2x. This implies the market is assigning a richer price tag to its earnings than the regression based fair ratio might support.
Compared with the US Capital Markets industry average P/E of 25.5x and a peer average of 22.5x, Jefferies trades at a clear discount. So while it screens as expensive versus the fair ratio, it still looks cheaper than many sector peers on current earnings.
Result: Price-to-Earnings of 20.1x (ABOUT RIGHT)
However, you still need to watch for any slowdown in deal activity hitting Jefferies’ US$7,343.751m revenue base, or pressure on its US$635.165m net income.
Another View: What the SWS DCF model says
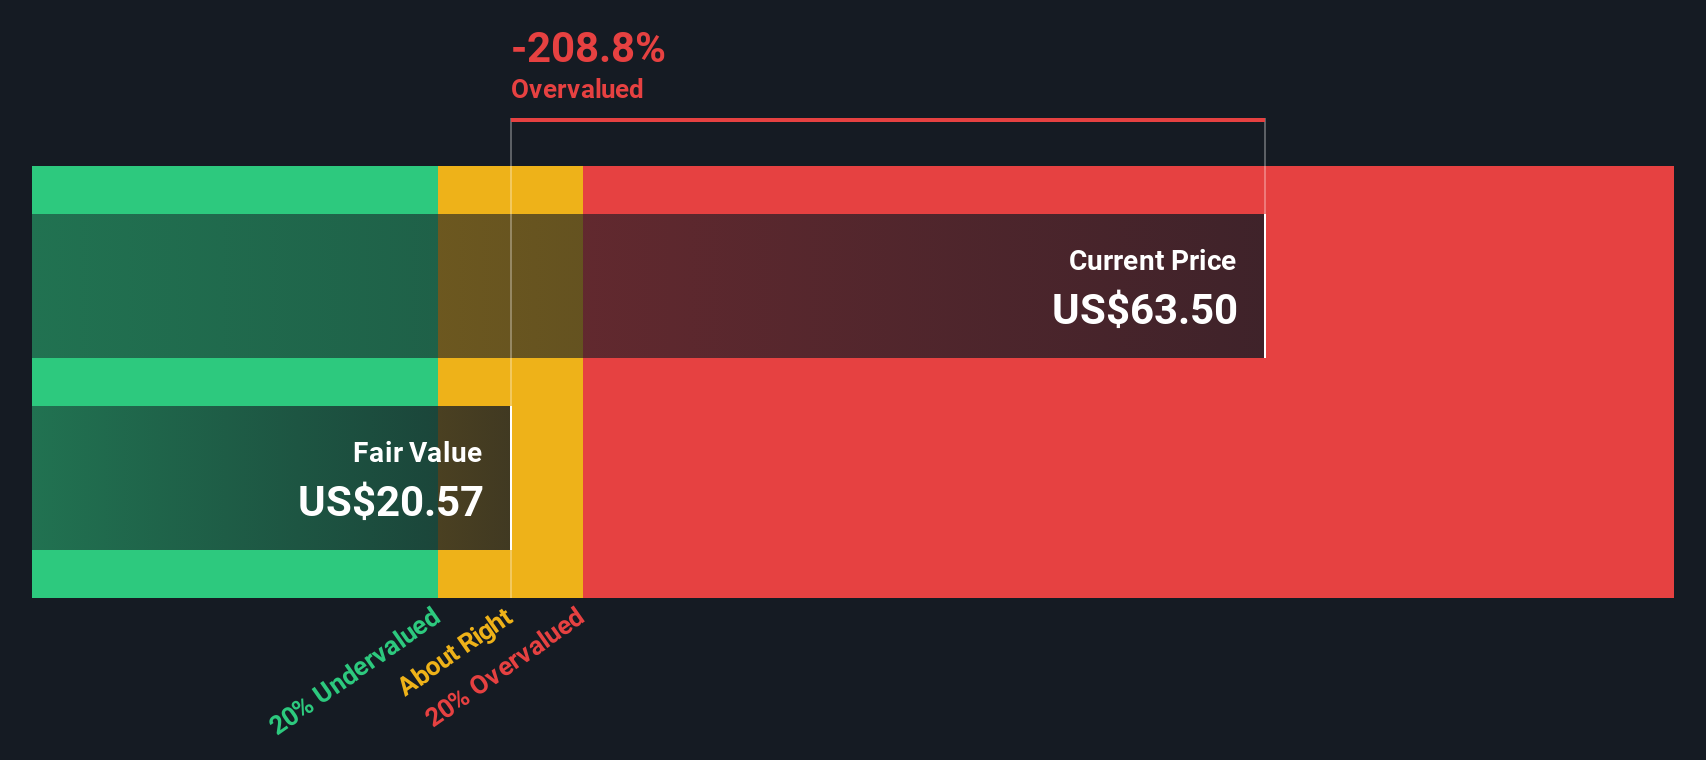
Our DCF model presents a different perspective. With Jefferies at US$61.95 and our estimate of future cash flow value at US$49.09, the shares appear expensive on this basis. If the market focuses more on cash flow calculations rather than earnings multiples, how much conviction do you really have?
Simply Wall St performs a discounted cash flow (DCF) on every stock in the world every day (check out Jefferies Financial Group for example). We show the entire calculation in full. You can track the result in your watchlist or portfolio and be alerted when this changes, or use our stock screener to discover 881 undervalued stocks based on their cash flows. If you save a screener we even alert you when new companies match - so you never miss a potential opportunity.
Build Your Own Jefferies Financial Group Narrative
If you see the numbers differently or prefer to test your own assumptions against the data, you can build a personalised view of Jefferies in just a few minutes with Do it your way.
A great starting point for your Jefferies Financial Group research is our analysis highlighting 2 key rewards and 1 important warning sign that could impact your investment decision.
Ready to find your next investment idea?
If Jefferies has you thinking bigger about your portfolio, do not stop here. Use the screener to hunt for the next idea before the crowd catches on.
- Target higher income potential by reviewing these 13 dividend stocks with yields > 3% that combine yield with underlying business fundamentals.
- Ride long term tech trends by scanning these 23 AI penny stocks that are tied to artificial intelligence themes.
- Position early in specialist sectors by assessing these 23 quantum computing stocks that sit at the frontier of computing technology.
This article by Simply Wall St is general in nature. We provide commentary based on historical data and analyst forecasts only using an unbiased methodology and our articles are not intended to be financial advice. It does not constitute a recommendation to buy or sell any stock, and does not take account of your objectives, or your financial situation. We aim to bring you long-term focused analysis driven by fundamental data. Note that our analysis may not factor in the latest price-sensitive company announcements or qualitative material. Simply Wall St has no position in any stocks mentioned.