A Look At Jefferies Financial Group (JEF) Valuation After Recent Share Price Momentum
Jefferies Financial JEF | 0.00 |
Jefferies Financial Group (JEF) has drawn investor attention after a recent share move, with the stock last closing at US$54.24 as its returns over the past month and past 3 months stand out.
Recent momentum has been strong, with the share price return of 10.04% over the past month and 21.64% over the past 3 months contrasting with a year to date share price decline of 14.53%. Meanwhile, the 1 year total shareholder return of 13.36% and 5 year total shareholder return of 104% underline how different short term moves can look compared with longer holding periods.
If Jefferies Financial Group has you looking at financial stocks more broadly, it could be a useful moment to widen your search through 20 top founder-led companies
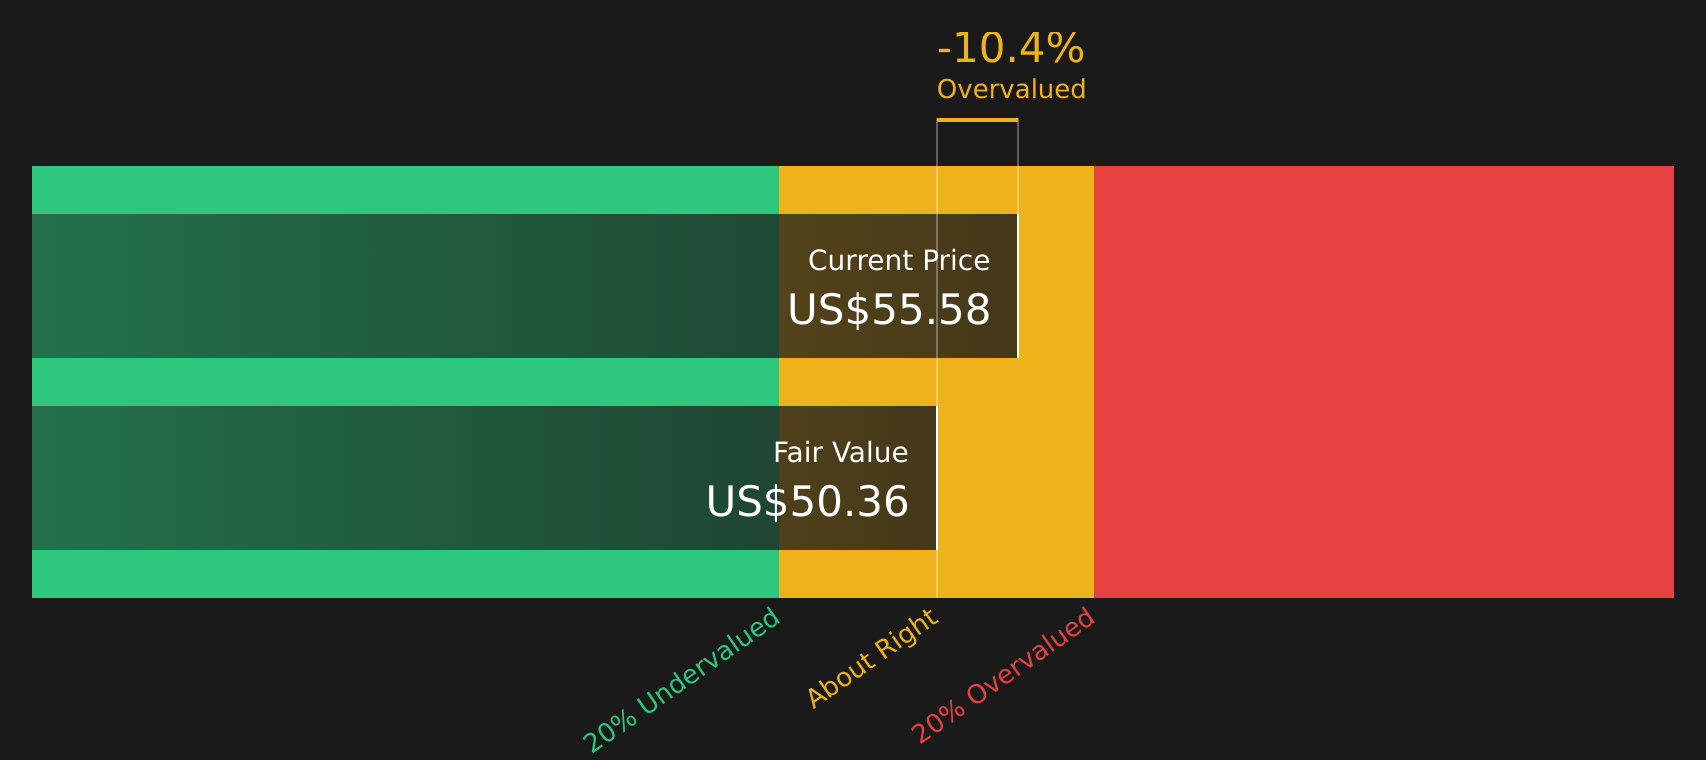
With Jefferies trading close to analyst targets and recent returns mixed across different timeframes, the key question is whether the current price undervalues its prospects or if the market is already pricing in future growth.
Price-to-Earnings of 16.7x: Is it justified?
Jefferies Financial Group trades on a P/E of 16.7x, which screens as good value against the broader US market yet slightly expensive versus close peers.
The P/E ratio compares the current share price with earnings per share and is a common way investors weigh what they are paying for each dollar of profit. For an investment banking and capital markets company like Jefferies, this tends to reflect expectations for deal activity, trading conditions, and the stability of earnings quality.
Jefferies is described as having high quality earnings, and its recent 4.3% earnings growth is a clear improvement on its 5 year average decline of 25.6% per year, so some investors may see the current P/E as a price on that turnaround. However, the stock is trading above the SWS DCF model estimate of future cash flow value at $45.48, and the current P/E of 16.7x sits slightly above the estimated fair P/E of 16.3x, suggesting the market is paying a small premium to what the regression based fair ratio implies.
Compared with the US Capital Markets industry average P/E of 39.5x, Jefferies looks inexpensive on earnings. At the same time, its 16.7x P/E is above the peer group average of 15.3x and above the 16.3x fair ratio level the market could move towards if sentiment cools or earnings do not keep pace with expectations.
Result: Price-to-Earnings of 16.7x (ABOUT RIGHT)
However, investors still need to watch for weaker deal activity in investment banking and capital markets, and any shift in sentiment if earnings momentum slows.
Another View: Cash Flows Point to a Different Story
While the 16.7x P/E looks roughly in line with the fair ratio, the SWS DCF model paints a different picture. On that cash flow based view, Jefferies is trading above an estimated value of $45.48 per share, which suggests less margin for error if conditions soften.
That kind of gap can matter if earnings forecasts are even slightly off, or if investor enthusiasm cools from here. It is worth asking which signal you trust more: the earnings multiple or the cash flow model.
Simply Wall St performs a discounted cash flow (DCF) on every stock in the world every day (check out Jefferies Financial Group for example). We show the entire calculation in full. You can track the result in your watchlist or portfolio and be alerted when this changes, or use our stock screener to discover 46 high quality undervalued stocks. If you save a screener we even alert you when new companies match - so you never miss a potential opportunity.
Next Steps
Mixed signals on valuation and sentiment can be useful, but they are only a starting point. Move quickly and review Jefferies' fundamentals, recent results and context for yourself, then weigh up the 2 key rewards and 1 important warning sign
Looking for more investment ideas?
If Jefferies has sharpened your focus, do not stop here. Use the wider market to spot fresh opportunities that fit your style before others do.
- Target companies that combine quality with potential mispricing by scanning the screener containing 22 high quality undiscovered gems.
- Prioritise resilience and capital preservation by reviewing the 63 resilient stocks with low risk scores.
- Hunt for businesses with robust finances and staying power through the solid balance sheet and fundamentals stocks screener (47 results).
This article by Simply Wall St is general in nature. We provide commentary based on historical data and analyst forecasts only using an unbiased methodology and our articles are not intended to be financial advice. It does not constitute a recommendation to buy or sell any stock, and does not take account of your objectives, or your financial situation. We aim to bring you long-term focused analysis driven by fundamental data. Note that our analysis may not factor in the latest price-sensitive company announcements or qualitative material. Simply Wall St has no position in any stocks mentioned.