A Look At Kodiak Sciences (KOD) Valuation After Positive GLOW2 Phase III Zenkuda Results
Kodiak Sciences Inc. KOD | 0.00 |
Why Kodiak Sciences Stock Is Back in Focus After GLOW2 Results
Kodiak Sciences (KOD) is drawing fresh attention after reporting positive top line Phase 3 GLOW2 data for Zenkuda in diabetic retinopathy, which has prompted accelerated regulatory plans and renewed interest in its ophthalmology pipeline.
The GLOW2 data initially helped extend Kodiak Sciences’ strong multi year run, with the 1 year total shareholder return now very large relative to the starting base. However, the share price has recently cooled, with a 30 day share price return of 32.34% down and a 7 day share price return of 15.42% down after a 90 day share price return of 24.90% up.
If you are looking for other healthcare related growth ideas on the back of this news, it could be worth scanning opportunities in 39 healthcare AI stocks
With Kodiak Sciences now valued around US$2.1b and trading at a very large 1 year total return, yet still sitting at a sizeable discount to both analyst targets and some intrinsic estimates, should you see current weakness as a buying opportunity, or as a sign that the market is already pricing in future growth?
Price to Book of 17.3x: Is It Justified?
Right now Kodiak Sciences trades on a P/B ratio of 17.3x, which is far higher than both its biotech peers and the broader market, despite the recent pullback in the share price.
P/B compares the company’s market value with its net assets on the balance sheet. A higher multiple usually reflects investors placing a premium on future potential rather than current earnings or revenue. For Kodiak Sciences, this is happening while the company is still unprofitable, has reported a net loss of $230.664m and currently makes less than $1m in revenue.
The implication is that the market is paying a substantial premium relative to assets for a business that is forecast to grow revenue 59.2% per year but is also forecast to remain unprofitable over the next 3 years and has less than one year of cash runway. Investors are effectively pricing in successful execution of the pipeline and future cash generation long before it shows up in the income statement.
Compared with the US Biotechs industry average P/B of 2.5x and a broader peer average of 3.9x, Kodiak Sciences’ 17.3x multiple sits in a very expensive bracket. That gap suggests expectations are far higher than for typical biotech peers, even though the company’s earnings profile is currently weaker and still loss making.
Result: Price to Book of 17.3x (OVERVALUED)
However, you also need to weigh clear risks, including Kodiak Sciences’ ongoing losses, minimal current revenue and less than one year of cash runway.
Another View: DCF Paints a Very Different Picture
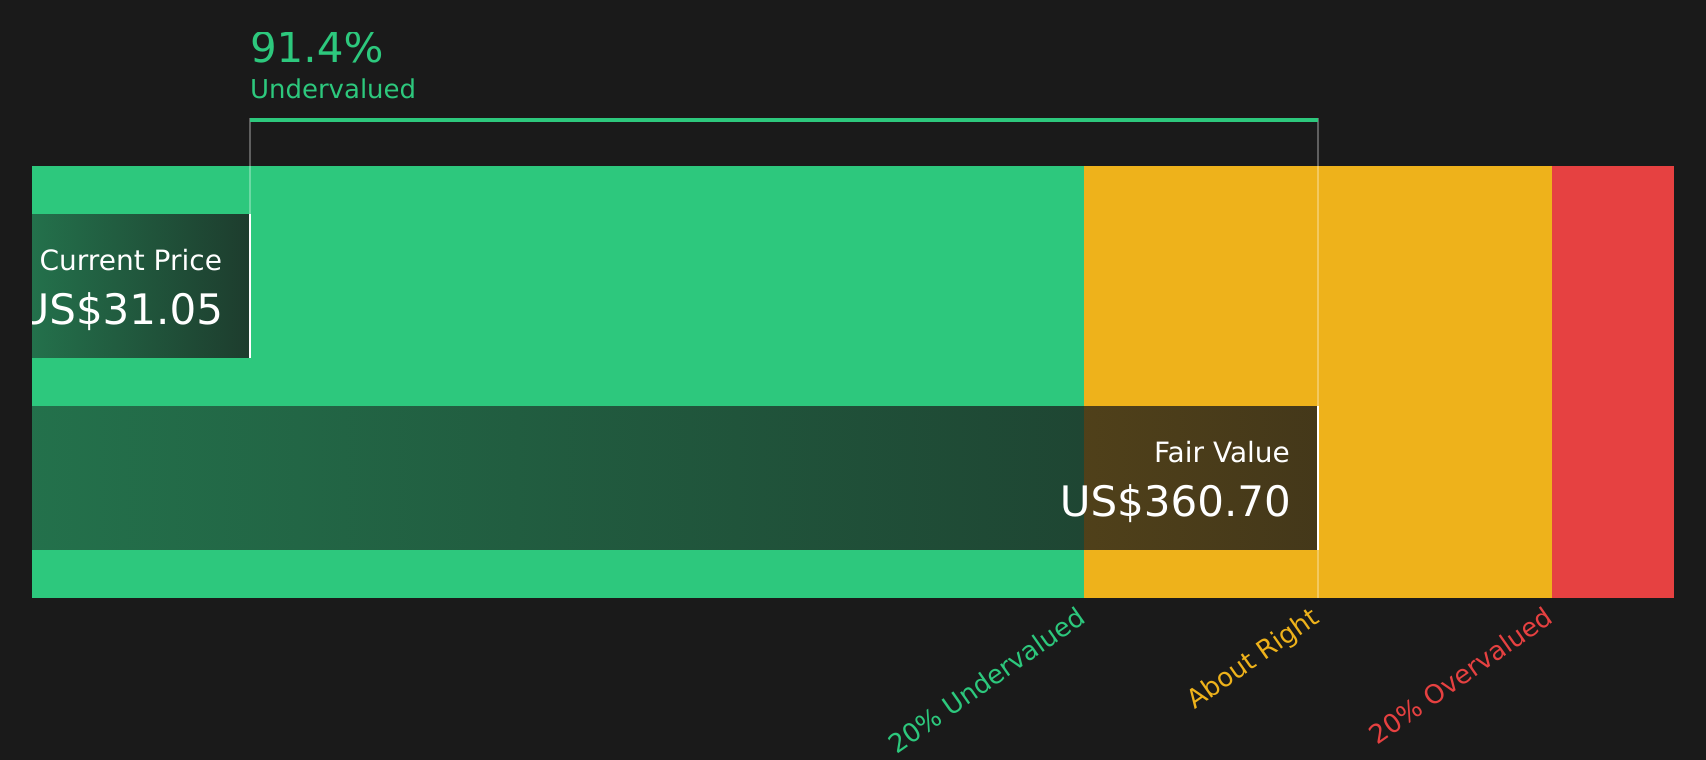
While the 17.3x P/B ratio flags Kodiak Sciences as expensive versus biotech peers, the SWS DCF model suggests something very different. At a share price of $31.05, the stock is trading at a very large discount to an estimated future cash flow value of $358.92. This raises the question of which signal you trust more.
Simply Wall St performs a discounted cash flow (DCF) on every stock in the world every day (check out Kodiak Sciences for example). We show the entire calculation in full. You can track the result in your watchlist or portfolio and be alerted when this changes, or use our stock screener to discover 49 high quality undervalued stocks. If you save a screener we even alert you when new companies match - so you never miss a potential opportunity.
Next Steps
With sentiment clearly mixed after strong GLOW2 headlines and a rich P/B, it helps to move quickly, review the full picture, and shape your own view using the 3 key rewards and 5 important warning signs.
Looking for more investment ideas?
If you stop with just one stock, you may miss other opportunities that fit your goals more closely, so widen your search before making your next move.
- Spot potential mispricings by scanning 49 high quality undervalued stocks that pair solid fundamentals with more reasonable valuations.
- Prioritise resilience by screening for 64 resilient stocks with low risk scores that may better match a cautious approach.
- Hunt for earlier stage opportunities using the 24 elite penny stocks with strong financials and see which smaller companies meet your quality filters.
This article by Simply Wall St is general in nature. We provide commentary based on historical data and analyst forecasts only using an unbiased methodology and our articles are not intended to be financial advice. It does not constitute a recommendation to buy or sell any stock, and does not take account of your objectives, or your financial situation. We aim to bring you long-term focused analysis driven by fundamental data. Note that our analysis may not factor in the latest price-sensitive company announcements or qualitative material. Simply Wall St has no position in any stocks mentioned.