A Look At Marsh & McLennan (MRSH) Valuation After Recent Share Price Softness
Marsh & McLennan Companies, Inc. MRSH | 174.61 | +1.59% |
Why Marsh & McLennan Companies (MRSH) is on investors’ radar today
Marsh & McLennan Companies (MRSH) continues to draw attention as investors review how its professional services and insurance solutions business lines align with recent share performance and fundamentals, even though there has not been a single headline event driving the move.
The stock has returned 0.3% over the past week and is roughly flat year to date. It has shown a 2.2% decline over the past month and a 1.7% decline over the past 3 months, set against a 12.4% negative 1 year total return.
The recent 2.2% 1 month share price decline to US$183.27 sits against a 12.4% negative 1 year total shareholder return, while the 5 year total shareholder return of 73.9% points to a much stronger longer term picture. This suggests that momentum has faded in the near term.
If Marsh & McLennan’s recent pullback has you reassessing your options, it could be a good moment to broaden your search with fast growing stocks with high insider ownership.
So with Marsh & McLennan trading at US$183.27, sitting on a 12.4% 1 year total return decline and an indicated 33.9% intrinsic discount, is there a genuine entry point here, or is future growth already priced in?
Most Popular Narrative: 13.3% Undervalued
With Marsh & McLennan’s fair value in the narrative set around US$211.33 against a last close of US$183.27, the gap in expectations is clear and sets up a detailed earnings and valuation story.
Analysts are assuming Marsh & McLennan Companies's revenue will grow by 5.9% annually over the next 3 years.
Analysts assume that profit margins will increase from 16.0% today to 17.4% in 3 years time.
Curious what kind of earnings profile and future P/E this narrative needs to support that fair value? The full story leans on specific revenue, margin and valuation targets that go well beyond today’s snapshot.
Result: Fair Value of $211.33 (UNDERVALUED)
However, the narrative could be tested if soft commercial P&C pricing persists or if consulting demand weakens further, which would put pressure on revenue growth and margins.
Another Angle on Valuation
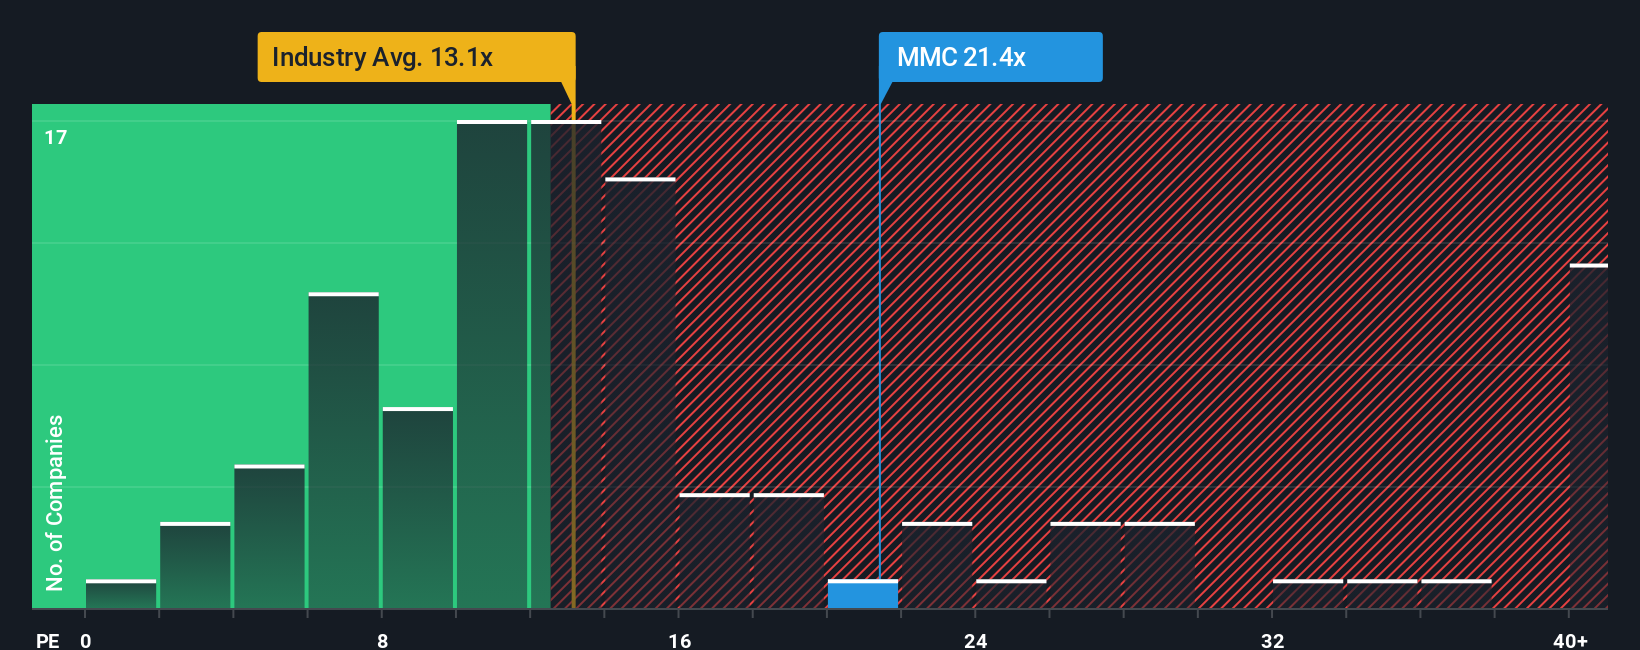
Here is where the story gets a bit more nuanced. On one hand, Marsh & McLennan screens as good value relative to peers, with a P/E of 21.8x versus a 27.7x peer average. On the other hand, that same 21.8x sits well above the US Insurance industry at 12.6x and above a fair ratio of 15.4x for the company.
In practice, that gap to the fair ratio suggests less room for error if earnings or sentiment soften further, even if the peer comparison looks supportive. The question for you is whether the current price feels like a sensible premium for quality or a valuation that needs more proof.
Build Your Own Marsh & McLennan Companies Narrative
If you look at the numbers and come to a different conclusion, or simply prefer to test your own assumptions, you can build a personalised view in just a few minutes with Do it your way.
A great starting point for your Marsh & McLennan Companies research is our analysis highlighting 4 key rewards and 1 important warning sign that could impact your investment decision.
Looking for more investment ideas?
If Marsh & McLennan has your attention, do not stop there. Broaden your watchlist with focused ideas that could sharpen how you think about opportunities and risk.
- Target potential mispricings by scanning these 875 undervalued stocks based on cash flows that align with your views on quality, cash flows and margin resilience.
- Ride the rise of automation and machine learning by checking out these 24 AI penny stocks that are tying real business models to emerging tools.
- Add a different angle to your watchlist by reviewing these 12 dividend stocks with yields > 3% that combine income potential with listed market exposure.
This article by Simply Wall St is general in nature. We provide commentary based on historical data and analyst forecasts only using an unbiased methodology and our articles are not intended to be financial advice. It does not constitute a recommendation to buy or sell any stock, and does not take account of your objectives, or your financial situation. We aim to bring you long-term focused analysis driven by fundamental data. Note that our analysis may not factor in the latest price-sensitive company announcements or qualitative material. Simply Wall St has no position in any stocks mentioned.