A Look At Miami International Holdings (MIAX) Valuation As Revenue Slips And Shares Trade Below Peer P/S Multiples
Miami International Holdings, Inc. MIAX | 40.17 | +2.03% |
Event context and recent performance
Miami International Holdings (MIAX) has been on investors’ radar after recent trading, with the stock closing at $42.55 as short term returns show a 0.5% decline over the past week and month.
While the recent 7 day and 30 day share price returns have been slightly negative, the 90 day share price return of 1.48% suggests momentum has cooled rather than accelerated so far this year.
If this kind of measured move has you looking around the market, it could be a good moment to broaden your watchlist with fast growing stocks with high insider ownership.
With Miami International Holdings trading at $42.55, analyst targets near $48.75, and an annual revenue figure of about $1.32 billion alongside a net loss, is there real value on the table or is the market already pricing in future growth?
Price-to-Sales of 2.8x: Is it justified?
At a last close of $42.55, Miami International Holdings is trading on a P/S of 2.8x, which screens as low against both peers and the wider US capital markets group.
The P/S ratio compares the company’s market value to its annual revenue and is a common way to look at exchanges and capital markets businesses that are not yet profitable. For MIAX, this lens helps sidestep current losses and focus instead on how investors are valuing each dollar of sales in options, futures and equities trading platforms.
Against a peer average P/S of 11.1x, MIAX’s 2.8x multiple sits at a steep discount, and it is also well below the US Capital Markets industry average of 4.2x. That is a clear gap in how the market values MIAX’s revenue stream compared with both direct peers and the broader group, which some investors may interpret as the level that sentiment could move toward if views on the business change.
Result: Price-to-sales of 2.8x (UNDERVALUED)
However, you still need to weigh the annual revenue decline of 17.6% and the current net loss of about US$97.1m, which could pressure sentiment if conditions worsen.
Another view on valuation
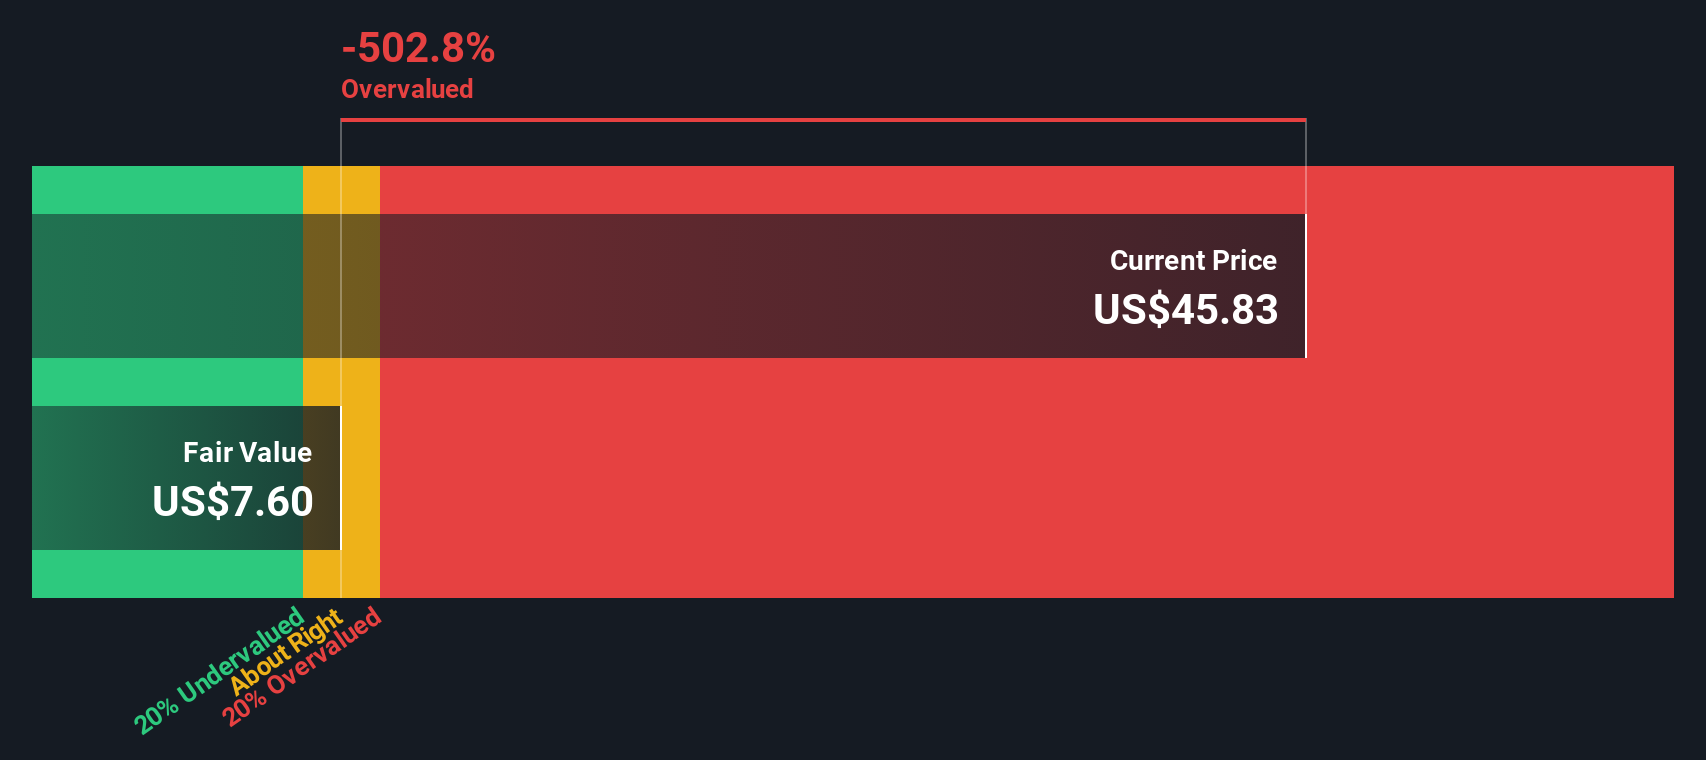
While the 2.8x P/S ratio screens as cheap against peers, our DCF model presents a different perspective, with an estimated fair value of US$12.97 per share compared to today’s US$42.55. That gap suggests the share price could already be baking in a lot, so which signal matters more to you?
Simply Wall St performs a discounted cash flow (DCF) on every stock in the world every day (check out Miami International Holdings for example). We show the entire calculation in full. You can track the result in your watchlist or portfolio and be alerted when this changes, or use our stock screener to discover 868 undervalued stocks based on their cash flows. If you save a screener we even alert you when new companies match - so you never miss a potential opportunity.
Build Your Own Miami International Holdings Narrative
If you view this data differently or would like to test your own assumptions, you can build a personalised Miami International Holdings view in minutes with Do it your way.
A good starting point is our analysis highlighting 1 key reward investors are optimistic about regarding Miami International Holdings.
Looking for more investment ideas?
If Miami International Holdings is on your radar, do not stop there. Broaden your options now so you are not relying on a single story.
- Spot potential turnaround candidates early by scanning these 3539 penny stocks with strong financials that pair smaller share prices with more robust fundamentals.
- Target themes shaping the future of tech by reviewing these 24 AI penny stocks that connect artificial intelligence with scalable business models.
- Focus on price tags that may sit below intrinsic value by checking these 868 undervalued stocks based on cash flows guided by cash flow based metrics.
This article by Simply Wall St is general in nature. We provide commentary based on historical data and analyst forecasts only using an unbiased methodology and our articles are not intended to be financial advice. It does not constitute a recommendation to buy or sell any stock, and does not take account of your objectives, or your financial situation. We aim to bring you long-term focused analysis driven by fundamental data. Note that our analysis may not factor in the latest price-sensitive company announcements or qualitative material. Simply Wall St has no position in any stocks mentioned.