A Look At Nexa Resources (NEXA) Valuation After Otavi Sale And Earnings Estimate Revisions
Nexa Resources S.A. NEXA | 11.07 | +0.73% |
Nexa Resources stock reacts to Otavi sale and earnings revisions
Nexa Resources (NEXA) moved after the company agreed to sell its Otavi Project in Namibia to Midnab Resources, with JOGMEC receiving 49% of the proceeds, and analysts sharply raising earnings estimates.
The share price has climbed to $11.82, with a 51.73% 30 day share price return and a 111.07% 90 day share price return. The 1 year total shareholder return of 94.01% points to strong recent momentum around the Otavi sale and earnings revisions.
If Nexa’s surge has you thinking about what else might be gaining attention in materials and beyond, it could be a good moment to look at fast growing stocks with high insider ownership.
With Nexa trading at $11.82 against an analyst target of $7.40, yet also showing an estimated intrinsic discount of 52%, there is a clear tension to weigh. Is there still an entry point here, or is the market already pricing in future growth?
Price-to-Sales of 0.6x: Is it justified?
On a P/S of 0.6x against a last close of $11.82, Nexa screens as undervalued when you line it up against both peers and the wider Metals and Mining industry.
The P/S ratio compares the company’s market value to its revenue, which can be useful for businesses like Nexa that are currently reporting a loss rather than positive earnings. For a miner and smelter with sizeable sales but negative net income, investors often look at P/S to gauge how much they are paying for each dollar of revenue while the earnings story is still developing.
Nexa is described as trading at good value compared to peers and industry, with a P/S of 0.6x versus a 10.5x peer average and a 2.8x US Metals and Mining industry average. That is a steep discount, and the estimated fair P/S ratio of 0.7x suggests the current multiple sits below a level the market could potentially move toward if sentiment and fundamentals align.
Result: Price-to-Sales of 0.6x (UNDERVALUED)
However, it is worth remembering Nexa is still reporting a net income loss of $16.229 million, and analysts’ $7.40 target sits well below the current price.
Another view on value: DCF vs market price
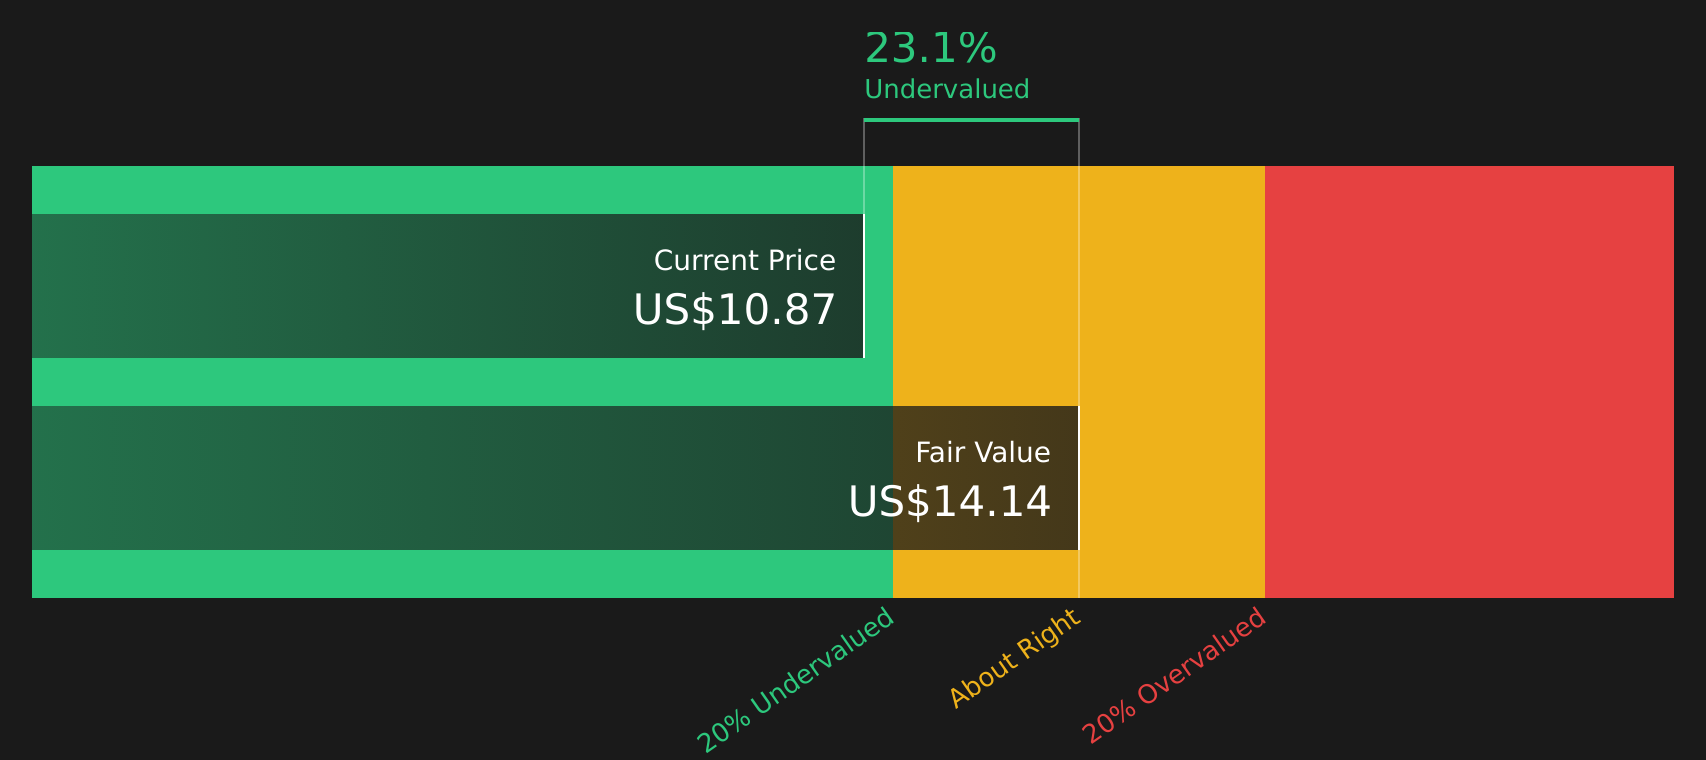
Our DCF model paints a very different picture to the P/S story. It points to a fair value of $24.86 per share, compared with the current $11.82, which implies Nexa trades at a large discount. If both methods are right, it raises the question of whether sentiment is simply lagging the fundamentals or whether the DCF is too optimistic.
Simply Wall St performs a discounted cash flow (DCF) on every stock in the world every day (check out Nexa Resources for example). We show the entire calculation in full. You can track the result in your watchlist or portfolio and be alerted when this changes, or use our stock screener to discover 885 undervalued stocks based on their cash flows. If you save a screener we even alert you when new companies match - so you never miss a potential opportunity.
Build Your Own Nexa Resources Narrative
If you look at these numbers and reach a different conclusion, or simply prefer to test your own view, you can build a personalized Nexa thesis in just a few minutes with Do it your way.
A good starting point is our analysis highlighting 3 key rewards investors are optimistic about regarding Nexa Resources.
Ready for more investment ideas?
If Nexa has sharpened your focus, do not stop here. The same tools can help you uncover other opportunities that might fit your style even better.
- Zero in on potential bargains by checking out these 885 undervalued stocks based on cash flows that may be trading below what their cash flows suggest.
- Explore technology-related ideas by scanning these 25 AI penny stocks that are tied to artificial intelligence and related themes.
- Target income-focused ideas by reviewing these 12 dividend stocks with yields > 3% that already offer yields above 3%.
This article by Simply Wall St is general in nature. We provide commentary based on historical data and analyst forecasts only using an unbiased methodology and our articles are not intended to be financial advice. It does not constitute a recommendation to buy or sell any stock, and does not take account of your objectives, or your financial situation. We aim to bring you long-term focused analysis driven by fundamental data. Note that our analysis may not factor in the latest price-sensitive company announcements or qualitative material. Simply Wall St has no position in any stocks mentioned.