A Look At Permian Basin Royalty Trust (PBT) Valuation After Its Lower Cash Distribution Announcement
Permian Basin Royalty Trust PBT | 0.00 |
Lower May distribution puts Permian Basin Royalty Trust (PBT) income stream in focus
Permian Basin Royalty Trust (PBT) has declared a cash distribution of US$0.020355 per unit, payable on June 12, 2026, to unit holders of record on May 29, 2026, following a reduction in its payout.
For income focused investors, the smaller distribution highlights how cash flows from the trust’s oil and gas royalty interests can shift over time and why it can be useful to track payout levels alongside unit price moves.
Despite the distribution cut weighing on sentiment and the share price falling 5.57% over the last day and 9.74% over the last week, PBT still shows strong momentum with a 30 day share price return of 24.68% and a one year total shareholder return of 153.63%.
If this kind of sharp move in an income focused stock has you thinking about where else capital is flowing, it may be worth scanning 33 elite gold producer stocks
With PBT’s unit price still up strongly over the past year despite the latest distribution cut, the key question now is whether the trust is trading below its underlying royalty value or if the market is already pricing in future growth.
Price-to-earnings of 88.6x: Is it justified?
PBT closed at $27.99, and the latest data shows the stock trading on a P/E of 88.6x, which is far higher than both its peer group and the broader US oil and gas industry.
The P/E ratio compares the current unit price with the trust’s earnings per unit. A higher figure often reflects strong expectations for future income or a willingness from investors to pay up for a relatively scarce earnings stream. For a royalty trust like Permian Basin Royalty Trust, where cash flows are tied to oil and gas production and pricing, a very high P/E can suggest the market is placing a premium on its current profitability and distribution potential.
However, the available data indicates that this premium is rich compared to other companies. PBT is described as expensive on a P/E of 88.6x against a peer average of 14.5x, and it is also flagged as expensive relative to the US oil and gas industry average P/E of 13.1x. That gap is wide, so anyone focused on valuation may want to ask whether earnings, which recently declined 34.6%, are robust enough to support such a multiple over time.
Result: Price-to-earnings of 88.6x (OVERVALUED)
However, earnings that recently declined 34.6% and a very rich P/E multiple could quickly come under pressure if oil and gas market conditions soften.
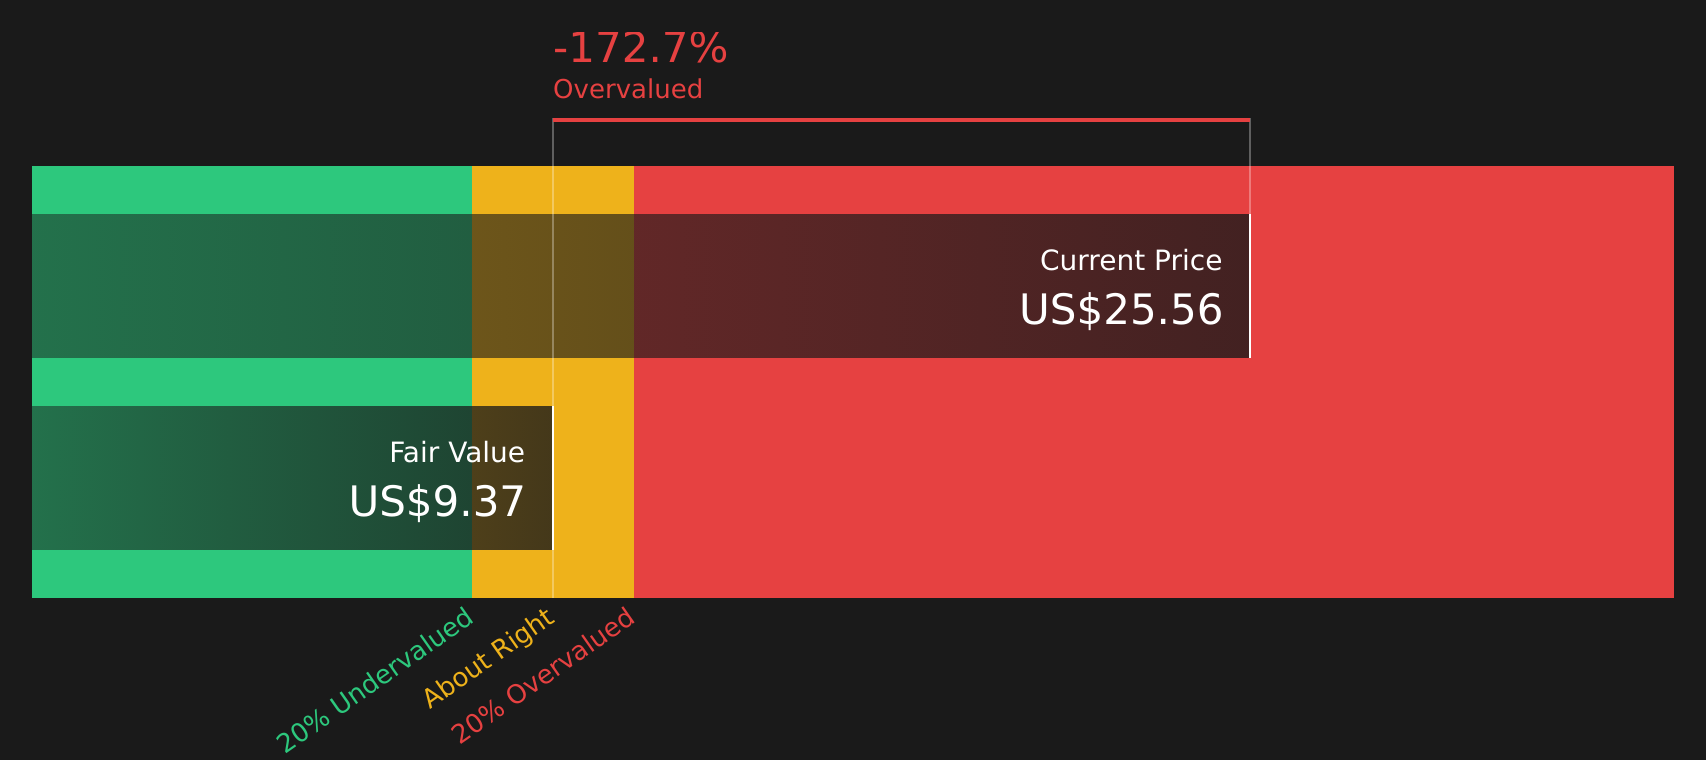
Another view of PBT’s $27.99 price
The rich P/E story is only one side of the valuation coin. Our DCF model points in the opposite direction, with PBT at $27.99 trading well above an estimated fair value of $9.37. This suggests the units look expensive when you focus on projected cash flows instead of current earnings.
For readers who rely on cash flow based models to cross check high multiples, this kind of gap can be a useful stress test for your thesis, especially if your income outlook already includes optimistic assumptions about future royalty checks.
Simply Wall St performs a discounted cash flow (DCF) on every stock in the world every day (check out Permian Basin Royalty Trust for example). We show the entire calculation in full. You can track the result in your watchlist or portfolio and be alerted when this changes, or use our stock screener to discover 46 high quality undervalued stocks. If you save a screener we even alert you when new companies match - so you never miss a potential opportunity.
Next Steps
Looking for more investment ideas?
If PBT has sharpened your focus on valuation and income, do not stop here. Broaden your watchlist and compare other opportunities before capital settles elsewhere.
- Target steady income potential by reviewing higher yielding companies in the 10 dividend fortresses.
- Hunt for quality at a price that may look appealing with the 46 high quality undervalued stocks.
- Prioritize resilience by checking companies screened through the 64 resilient stocks with low risk scores.
This article by Simply Wall St is general in nature. We provide commentary based on historical data and analyst forecasts only using an unbiased methodology and our articles are not intended to be financial advice. It does not constitute a recommendation to buy or sell any stock, and does not take account of your objectives, or your financial situation. We aim to bring you long-term focused analysis driven by fundamental data. Note that our analysis may not factor in the latest price-sensitive company announcements or qualitative material. Simply Wall St has no position in any stocks mentioned.