

A Look At Ralph Lauren (RL) Valuation After Earnings Beat And Higher Shareholder Returns
Ralph Lauren Corporation Class A RL | 0.00 |
Ralph Lauren (RL) shares have been in focus after the company reported quarterly and full year results that topped Wall Street expectations, paired with higher guidance, a dividend increase and continued share repurchases.
Despite a small pullback in the latest session, with a 1-day share price return that declined 1.45% to US$370.77, Ralph Lauren’s 1-year total shareholder return of 35.06% and very large 3-year and 5-year total shareholder returns suggest momentum has been strong as investors respond to repeated earnings beats, richer dividends and ongoing buybacks.
If strong recent performance at Ralph Lauren has your attention, this could be a good time to broaden your watchlist with other consumer facing companies and uncover 20 top founder-led companies
With earnings ahead of expectations, higher guidance, richer dividends and steady buybacks already in the mix, the real question now is whether Ralph Lauren’s current share price leaves any upside on the table or if markets are already pricing in future growth.
Most Popular Narrative: 10.3% Undervalued
Ralph Lauren’s most followed narrative pegs fair value at $413.33, above the last close at $370.77. This puts a clear spotlight on what assumptions support that gap.
Accelerating international expansion, especially in Asia and Greater China where sales grew over 30% and now represent 9% of company revenue (up from 3 to 4% a few years ago), positions Ralph Lauren to benefit from rising global wealth and middle class growth, supporting sustained top line revenue gains.
Curious how a premium brand, steady revenue growth, higher margins and a richer future P/E all feed into that fair value? The narrative connects them in a way raw numbers alone do not.
Result: Fair Value of $413.33 (UNDERVALUED)
However, this depends on Europe not slowing more than management anticipates and on higher inventories not forcing heavier discounting that eats into margins.
Another View: Earnings Model Points to Less Upside
While the popular narrative suggests fair value around $413.33, the SWS DCF model paints a more cautious picture. In that cash flow view, Ralph Lauren’s estimated value is $332.31, below the current $370.77 share price. This implies less of a margin of safety if growth or margins soften.
For a closer look at how this cash flow view is built and why it comes out lower than the narrative fair value, Look into how the SWS DCF model arrives at its fair value.
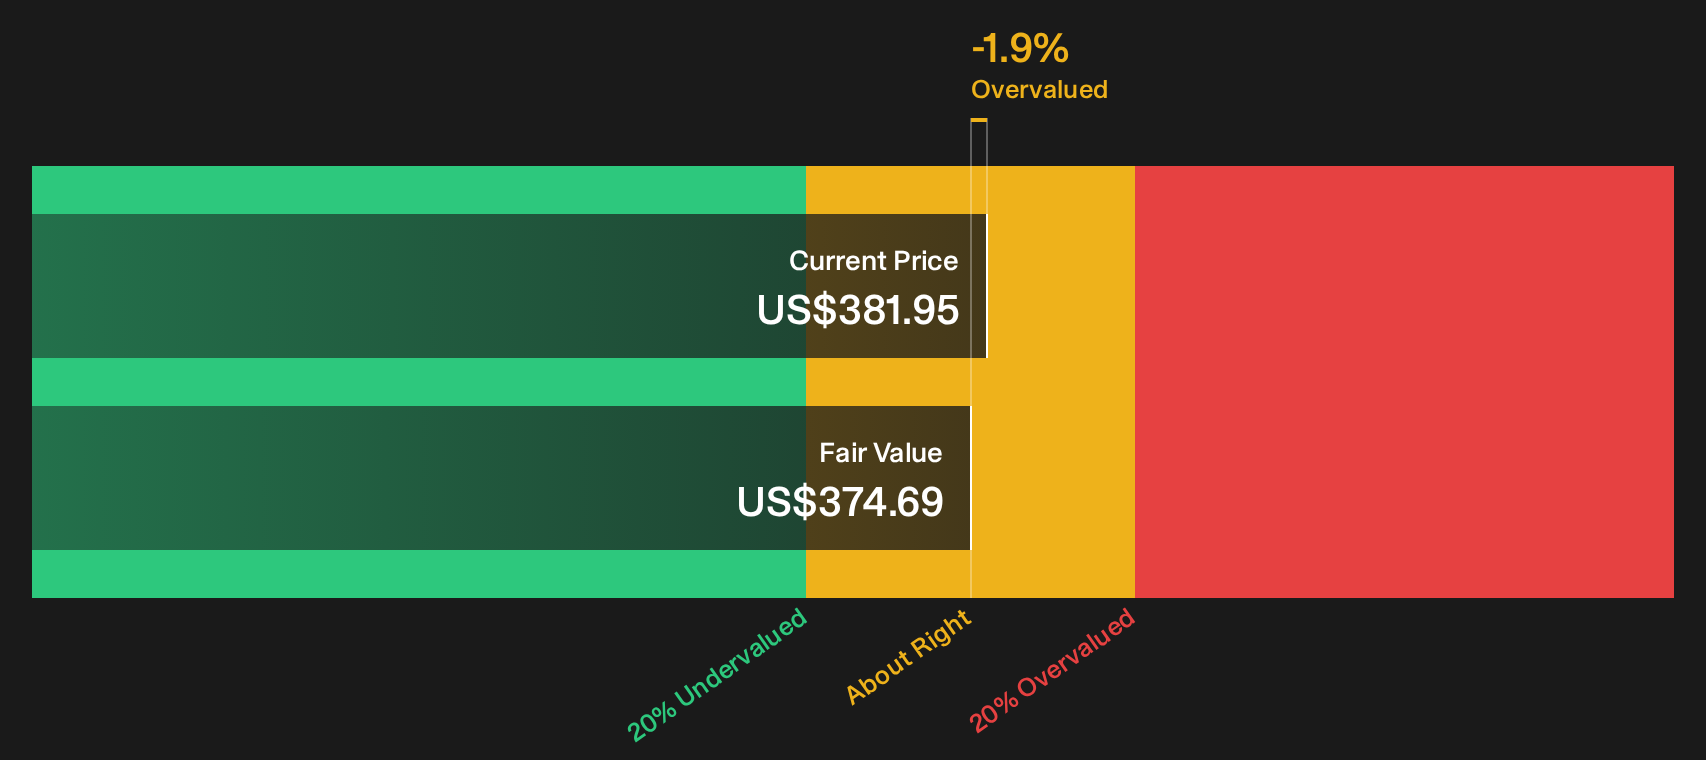
Simply Wall St performs a discounted cash flow (DCF) on every stock in the world every day (check out Ralph Lauren for example). We show the entire calculation in full. You can track the result in your watchlist or portfolio and be alerted when this changes, or use our stock screener to discover 46 high quality undervalued stocks. If you save a screener we even alert you when new companies match - so you never miss a potential opportunity.
Next Steps
With upbeat sentiment running through this update, it is helpful to move quickly, review the underlying data yourself and pressure test the assumptions. To see what investors are optimistic about, check out the 3 key rewards
Looking for more investment ideas?
If Ralph Lauren is already on your radar, do not stop there. Broaden your opportunity set now before the next wave of stock ideas moves without you.
- Target potential mispricings by scanning a focused list of 46 high quality undervalued stocks that combine quality fundamentals with attractive valuations.
- Strengthen your income stream by scouting dependable payers through our collection of 10 dividend fortresses that aim to keep distributions flowing.
- Protect your downside by filtering for 64 resilient stocks with low risk scores so you can focus on companies with more resilient profiles.
This article by Simply Wall St is general in nature. We provide commentary based on historical data and analyst forecasts only using an unbiased methodology and our articles are not intended to be financial advice. It does not constitute a recommendation to buy or sell any stock, and does not take account of your objectives, or your financial situation. We aim to bring you long-term focused analysis driven by fundamental data. Note that our analysis may not factor in the latest price-sensitive company announcements or qualitative material. Simply Wall St has no position in any stocks mentioned.