A Look At Red Cat Holdings (RCAT) Valuation As Drone And Maritime Expansion Plans Take Shape
RED CAT HOLDINGS RCAT | 0.00 |
Stock performance snapshot and business overview
Red Cat Holdings (RCAT) has drawn attention after recent trading, with the stock closing at $14.74 and showing mixed short and longer term returns across the past week, month, past 3 months, and year.
The company focuses on drone and robotic solutions for defense, national security, and commercial customers. All reported revenue of $54.57 million comes from recreational products in the United States, and the company has a market value of about $2.07 billion.
Recent trading has been strong, with the stock’s 30-day share price return of 41.32% and year to date share price return of 60.92% coming alongside a very large 3-year total shareholder return. However, the 90-day share price return is down 4.04%, which suggests that momentum has cooled slightly in the shorter term.
If you are interested in other companies exposed to drones, defense, and automation, this is a good moment to scan the wider robotics theme and check out 33 robotics and automation stocks
With Red Cat posting a 61% year to date share price gain, strong recent revenue and net income growth, and trading about 51% below one analyst price target, is there still a buying opportunity here, or is the market already pricing in future growth?
Most Popular Narrative: 13.3% Undervalued
Red Cat Holdings' most followed narrative points to a fair value of $17 per share, compared with the last close at $14.74. This frames the current debate around upside potential versus execution risk.
Expansion into uncrewed surface vessels through Blue Ops, with planned capacity for 500 to 1,000 vessels per year and unit pricing mentioned between about US$750,000 and US$1.5 million, adds a second major product line that could diversify and scale revenue beyond current drone programs.
Approval of Black Widow for the NATO NSPA catalog and the U.S. Blue UAS cleared list, along with foreign partner deployments, broadens the addressable market across U.S. and allied defense buyers. This can support higher order intake and improved gross profit through better factory utilization.
Want to see what sits behind that fair value call? The narrative leans on aggressive revenue expansion, margin repair, and a future earnings multiple that assumes a very different profit profile.
Result: Fair Value of $17 (UNDERVALUED)
However, there are still moving parts, including very large assumed revenue growth and a future P/E of 113x that could easily challenge this undervaluation story.
Another angle on valuation
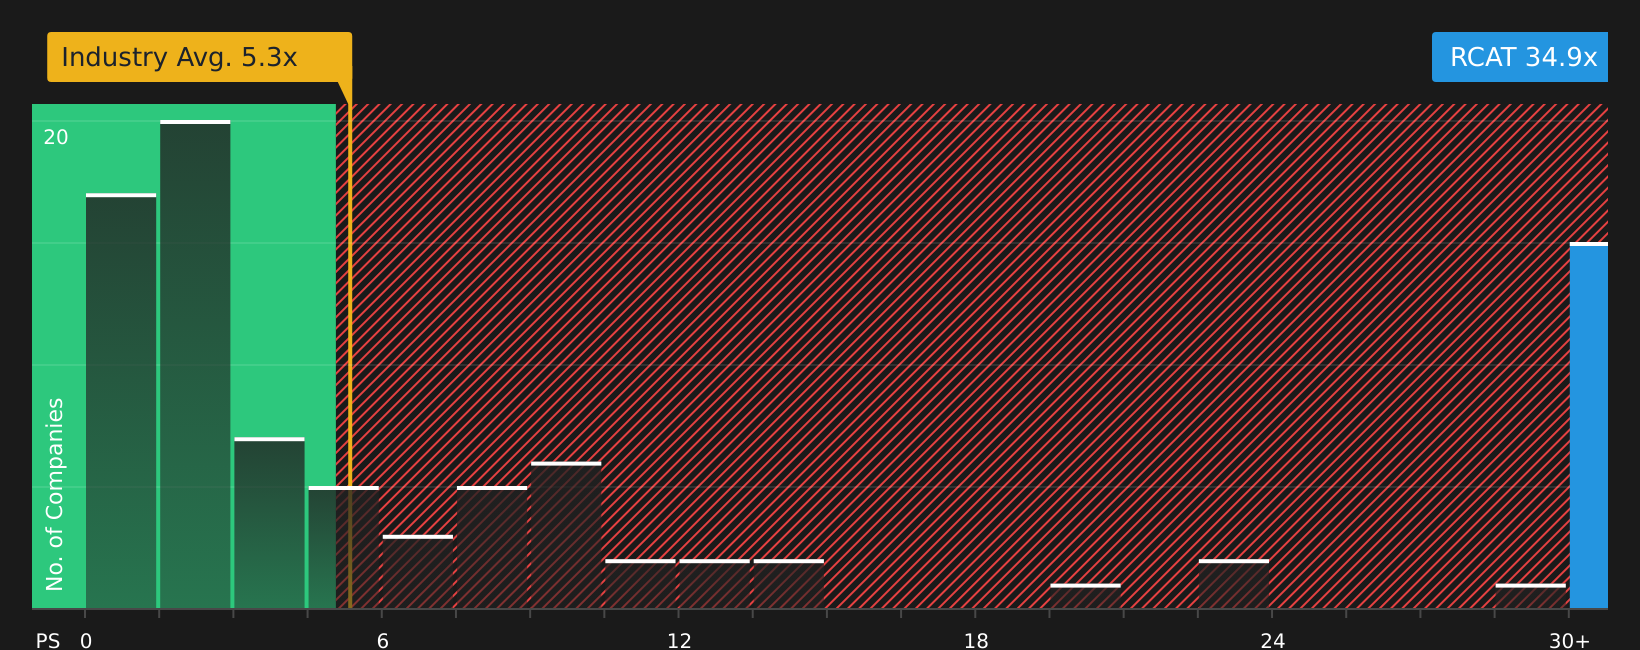
The fair value story points to Red Cat being 13.3% undervalued at $17 per share, but the P/S ratio tells a tougher story. At 40.6x P/S versus about 5.4x for the US Aerospace & Defense industry, 4.5x for peers, and a 6.5x fair ratio, a lot of future growth already sits in the price. How comfortable are you with that gap?
To see how this pricing compares with other companies using the same yardstick, and what it could mean if the market drifts toward the fair ratio, See what the numbers say about this price — find out in our valuation breakdown.
Next Steps
With sentiment clearly split between upside potential and valuation risk, it makes sense to move quickly, review the data yourself, and decide where you stand. A good place to start is 2 key rewards and 3 important warning signs.
Looking for more investment ideas?
If you stop here, you only see a fraction of what the market is offering. Use the tools available and make sure your next move is informed and intentional.
- Target dependable cash generators by reviewing companies in the 10 dividend fortresses that may suit an income focused approach.
- Hunt for potential value opportunities by checking the screener containing 22 high quality undiscovered gems before they attract wider attention.
- Prioritize resilience and aim to sleep easier at night by scanning the 65 resilient stocks with low risk scores for stocks with more measured risk profiles.
This article by Simply Wall St is general in nature. We provide commentary based on historical data and analyst forecasts only using an unbiased methodology and our articles are not intended to be financial advice. It does not constitute a recommendation to buy or sell any stock, and does not take account of your objectives, or your financial situation. We aim to bring you long-term focused analysis driven by fundamental data. Note that our analysis may not factor in the latest price-sensitive company announcements or qualitative material. Simply Wall St has no position in any stocks mentioned.