A Look At Restaurant Brands International (QSR) Valuation After The New Burger King China Joint Venture
Restaurant Brands International, Inc. QSR | 76.58 | +1.97% |
Why Burger King China’s new joint venture matters for Restaurant Brands International (QSR)
Restaurant Brands International (QSR) just closed a major joint venture with CPE, which injected $350 million into Burger King China and took an 83% stake, leaving RBI with a 17% minority interest.
The deal includes a 20 year master development agreement that grants exclusive rights to grow the Burger King brand in China, with a plan to expand the network from about 1,250 restaurants to more than 4,000 by 2035.
Against this joint venture backdrop, Restaurant Brands International’s share price has shown steady positive momentum, with a 7 day share price return of 5.84% and a year to date share price return of 4.56%. The 1 year total shareholder return of 14.72% points to gains that include both price moves and dividends.
If this kind of brand expansion story interests you, it could be a good moment to see what else is moving and check out 22 top founder-led companies as another source of ideas.
With Restaurant Brands International trading at $70.90, an implied upside of about 10% to analyst targets and a modeled intrinsic discount of roughly 16%, investors may ask whether there is still an opportunity at this price or whether the market is already fully reflecting expectations for future growth.
Most Popular Narrative: 9.6% Undervalued
Restaurant Brands International’s most followed narrative marks fair value at $78.45 versus the current $70.90 share price, which sets up a modest undervaluation story rooted in long term cash flows rather than short term trading swings.
Rapid international expansion, particularly through the franchise-led model in markets such as China, India, Turkey, Japan, and Brazil, is driving double-digit unit and system-wide sales growth; this directly supports recurring, capital-light revenue streams and higher long-term earnings visibility.
Sustained investment in digital capabilities, including rollout of new AI-driven operational technologies, digital ordering platforms, loyalty apps, and personalized marketing, positions RBI to enhance order volume, streamline store operations, and boost per-store sales and EBITDA margins over time.
Curious what sits behind that valuation gap? The most followed narrative leans heavily on measured revenue growth, rising margins and a future earnings power that only fully comes into focus when you see the detailed projections and discount rate assumptions that feed into that $78.45 figure.
Result: Fair Value of $78.45 (UNDERVALUED)
However, the story can change quickly if cost inflation bites into margins or if international expansion projects, such as those in China or France, encounter prolonged execution snags.
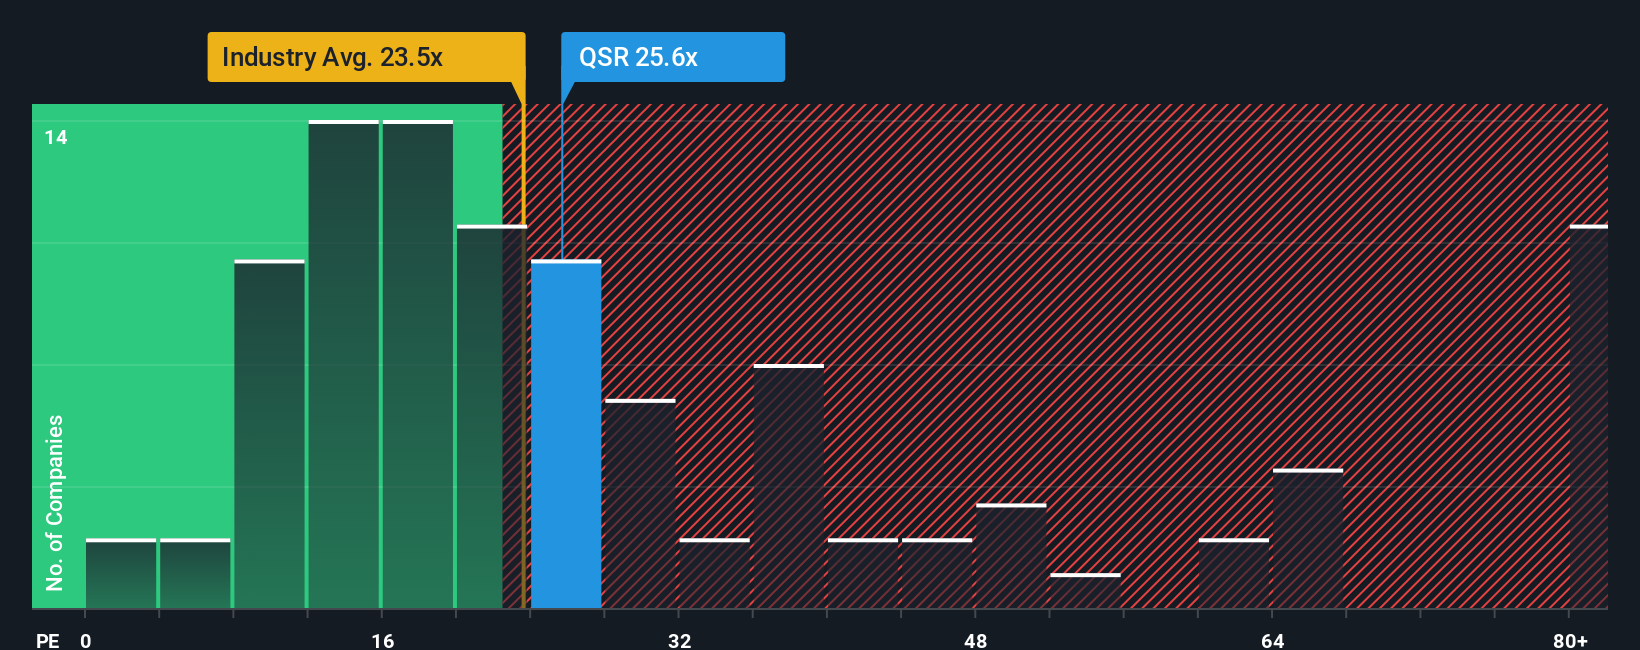
Another way to look at the price: earnings multiples
While our DCF model suggests Restaurant Brands International is trading about 16.2% below its estimated future cash flow value at $84.56, the P/E story is less clear cut. The current 25x P/E sits above the US Hospitality average of 22x, yet below a 29.5x fair ratio and the 26.6x peer average. For you, that mix of discount and premium raises a simple question: are you being paid enough for the risk you take on the stock at today’s price?
Build Your Own Restaurant Brands International Narrative
If you see the data differently or just prefer to test your own assumptions, you can build a full RBI story yourself in a few minutes, starting with Do it your way.
A great starting point for your Restaurant Brands International research is our analysis highlighting 3 key rewards and 3 important warning signs that could impact your investment decision.
Looking for more investment ideas?
If you want to broaden your watchlist beyond Restaurant Brands International, now is the time to scout for other potential opportunities before the crowd catches on.
- Target dependable paychecks by reviewing our list of 14 dividend fortresses that focus on income potential with higher yields.
- Hunt for price gaps by checking out 52 high quality undervalued stocks, where current market prices sit below our assessment of quality and fundamentals.
- Spot lesser known potential by scanning our screener containing 24 high quality undiscovered gems that filter for strong fundamentals away from the usual headlines.
This article by Simply Wall St is general in nature. We provide commentary based on historical data and analyst forecasts only using an unbiased methodology and our articles are not intended to be financial advice. It does not constitute a recommendation to buy or sell any stock, and does not take account of your objectives, or your financial situation. We aim to bring you long-term focused analysis driven by fundamental data. Note that our analysis may not factor in the latest price-sensitive company announcements or qualitative material. Simply Wall St has no position in any stocks mentioned.