

A Look At Rocket Companies (RKT) Valuation After Recent Share Price Swings
Rocket RKT | 0.00 |
Recent performance context
Rocket Companies (RKT) has drawn attention after a mixed stretch for the stock, with a modest gain over the past month but a decline of about 20% over the past 3 months.
At a last close of US$14.51 and a market value of about US$40.7b, investors are weighing that share performance against reported annual revenue of US$8.9b and net income of US$239 million.
Stepping back, Rocket Companies' recent 7 day share price return of 5.22% comes after a 90 day share price decline of about 20%, while the 3 year total shareholder return of 85.18% shows how different the longer term picture has been.
If you are comparing Rocket Companies with other opportunities in fintech and beyond, this could be a good moment to broaden your search and check out 21 top founder-led companies
So with Rocket Companies trading at US$14.51, sitting below the average analyst price target yet carrying a low value score of 2, should you view this as a mispriced stock or as a case of markets already baking in future growth?
Most Popular Narrative: 27.6% Undervalued
Rocket Companies' most followed narrative pegs fair value at about $20.05 per share compared with the last close of $14.51, so the story hinges on whether its business model can deliver the growth implied.
The market may be ascribing premium value to Rocket's data ecosystem and cross sell capabilities from the expanded "FinTech ecosystem," but this could prove overly optimistic if younger demographic cohorts delay home buying due to persistent affordability problems, thus dampening anticipated growth in customer lifetime value and overall revenues.
Want to understand why this fair value leans so much on future profitability and scale effects, rather than today's earnings picture? The narrative leans on a blend of faster revenue expansion, higher margins and a richer future earnings multiple to bridge the gap between current price and that $20.05 figure.
Result: Fair Value of $20.05 (UNDERVALUED)
However, there are clear risks, from housing affordability pressures to rising fintech competition, that could limit mortgage growth and squeeze the margins that underpin this narrative.
Another View: Cash Flow Model Paints A Tighter Picture
The analyst narrative points to a fair value of $20.05, but our DCF model tells a different story. On that cash flow view, Rocket Companies at $14.51 is trading above an estimated value of $12.52, which frames the stock as overvalued instead of 27.6% undervalued. Which story do you trust more: earnings potential or cash flows today?
For a closer look at how that cash flow view is built, and what would need to change to shift it, Look into how the SWS DCF model arrives at its fair value.
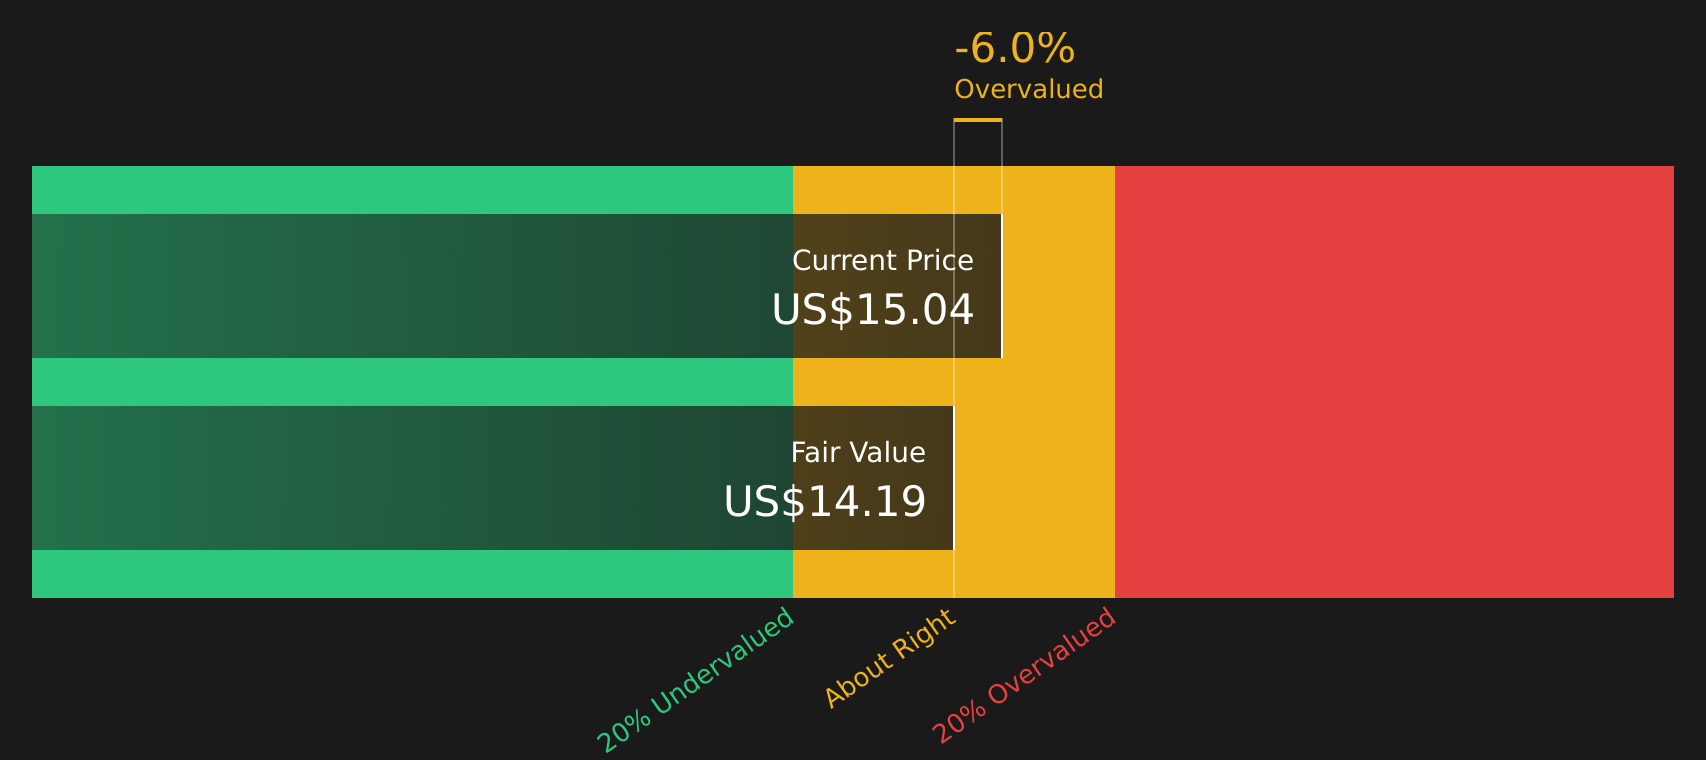
Simply Wall St performs a discounted cash flow (DCF) on every stock in the world every day (check out Rocket Companies for example). We show the entire calculation in full. You can track the result in your watchlist or portfolio and be alerted when this changes, or use our stock screener to discover 45 high quality undervalued stocks. If you save a screener we even alert you when new companies match - so you never miss a potential opportunity.
Next Steps
Mixed signals around value and risk can be confusing, so use this as a prompt to review the underlying data, weigh both sides, and act while the picture is still fresh in your mind by checking out the 3 key rewards and 2 important warning signs
Looking for more investment ideas?
If Rocket Companies has sharpened your focus, do not stop here. Broaden your watchlist using targeted stock ideas built from the Simply Wall St Screener.
- Spot potential value opportunities early by reviewing companies flagged in the 45 high quality undervalued stocks.
- Prioritise resilience in tougher markets by checking stocks highlighted in the 64 resilient stocks with low risk scores.
- Hunt for tomorrow's potential standouts by scanning the screener containing 22 high quality undiscovered gems.
This article by Simply Wall St is general in nature. We provide commentary based on historical data and analyst forecasts only using an unbiased methodology and our articles are not intended to be financial advice. It does not constitute a recommendation to buy or sell any stock, and does not take account of your objectives, or your financial situation. We aim to bring you long-term focused analysis driven by fundamental data. Note that our analysis may not factor in the latest price-sensitive company announcements or qualitative material. Simply Wall St has no position in any stocks mentioned.