A Look At Sempra (SRE) Valuation As LNG Output Begins And Grid Resilience Efforts Advance
Sempra SRE | 0.00 |
Sempra (SRE) stock is trading against a backdrop of fresh operational news, as the company reports first LNG production at its ECA LNG Phase 1 project in Mexico and grid upgrades at San Diego Gas & Electric.
At a share price of $91.42, Sempra’s 1 day share price return of 1.2% and 7 day share price return of 2.6% sit against a softer 30 day share price move. A 1 year total shareholder return of 22.6% and 5 year total shareholder return of 50.5% reflect momentum that has built over time as investors weigh recent LNG progress, grid investments and fresh activist pressure around a potential Oncor spin off.
If Sempra’s grid and LNG projects interest you, it can be useful to compare them with other power infrastructure opportunities using our 33 power grid technology and infrastructure stocks
Recent returns, fresh LNG output and an active debate over a potential Oncor spin off all feed into one question: is Sempra’s current US$91.42 share price conservative, or is the stock already reflecting much of its future growth story?
Price-to-Earnings of 31x: Is it justified?
Sempra's current P/E of 31x, compared with its $91.42 share price, points to a richer valuation than both its peers and the broader integrated utilities industry.
The P/E ratio compares the share price to earnings per share, so a higher P/E usually means investors are willing to pay more today for each dollar of current earnings. For a regulated utilities company, this often reflects how investors view the stability of earnings, expectations for future profit growth or the appeal of long term infrastructure assets such as LNG and power networks.
In Sempra's case, the P/E of 31x sits above the estimated fair P/E of 26.8x. This suggests the current price builds in stronger expectations than the level our fair ratio model indicates the market could revert toward. That is alongside forecast earnings growth of 14.6% per year, high quality earnings and a 1 year total shareholder return that exceeded the integrated utilities industry, while recent net profit margins and interest coverage highlight that the earnings profile is not without pressure.
Against global integrated utilities, where the average P/E is 19x and the peer group average is 19.6x, Sempra's 31x multiple stands out as materially higher. This implies a premium pricing of its earnings versus similar companies in the sector.
Result: Price-to-Earnings of 31x (OVERVALUED)
However, your thesis could be shaken if LNG projects face delays or regulators push back on grid and Oncor related plans, which could affect capital needs and earnings.
Wall Street's queuing for one rocket. While SpaceX counts down to its IPO, other companies tied to the new space race are already in orbit. → 20 Compelling Space Companies watchlist · Global Space Race Investing Ideas screener · Scan the sector by valuation on Rocket Lab's valuation page.
Another view: cash flows paint a different picture
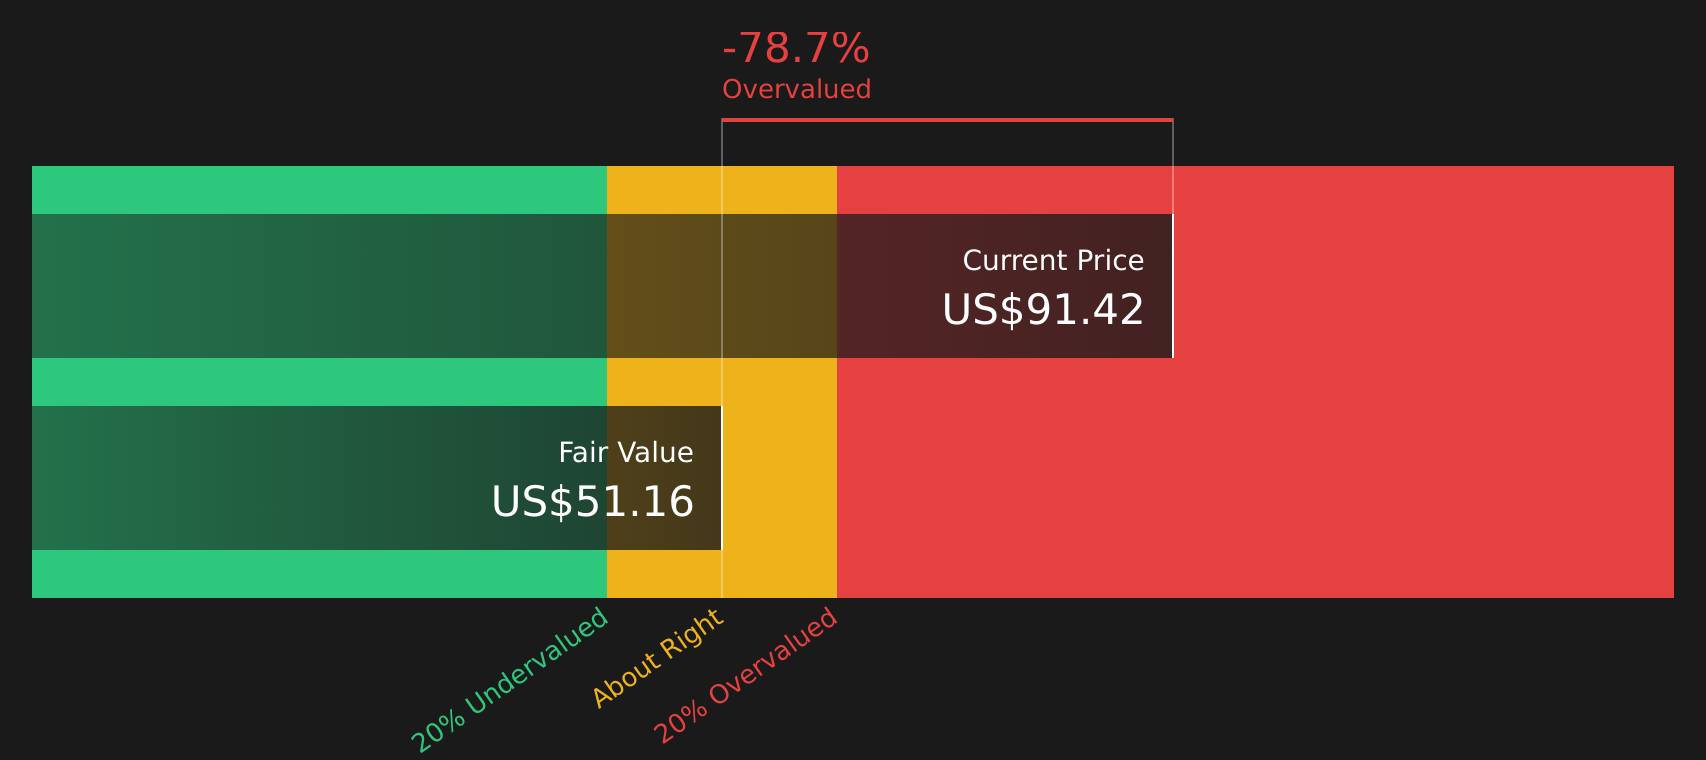
While the 31x P/E points to an expensive stock, the SWS DCF model goes even further. On this view, Sempra's estimated future cash flow value sits at $51.16 per share against the current $91.42 price, suggesting the stock is trading well above that cash flow based estimate. Which lens do you trust more when earnings and cash flows point to different risks?
Simply Wall St performs a discounted cash flow (DCF) on every stock in the world every day (check out Sempra for example). We show the entire calculation in full. You can track the result in your watchlist or portfolio and be alerted when this changes, or use our stock screener to discover 49 high quality undervalued stocks. If you save a screener we even alert you when new companies match - so you never miss a potential opportunity.
Next Steps
With sentiment clearly mixed on valuation, LNG progress and utility risks, it makes sense to check the key data points yourself and move quickly if your view differs from the market. To balance the concerns against the potential upside, take a closer look at the 1 key reward and 3 important warning signs
Looking for more investment ideas?
If you stop here, you could miss stocks that better match your goals, so take a few minutes to scan other ideas before making any moves.
- Target income-focused opportunities by reviewing companies in the 9 dividend fortresses for potential yield and resilience.
- Spot potential value candidates by checking out the 49 high quality undervalued stocks that combine quality with pricing that may appeal to patient investors.
- Prioritise resilience by filtering for companies in the 64 resilient stocks with low risk scores that score well on stability and financial strength.
This article by Simply Wall St is general in nature. We provide commentary based on historical data and analyst forecasts only using an unbiased methodology and our articles are not intended to be financial advice. It does not constitute a recommendation to buy or sell any stock, and does not take account of your objectives, or your financial situation. We aim to bring you long-term focused analysis driven by fundamental data. Note that our analysis may not factor in the latest price-sensitive company announcements or qualitative material. Simply Wall St has no position in any stocks mentioned.