A Look At SIGA Technologies (SIGA) Valuation After Weaker First Quarter 2026 Results
SIGA Technologies Inc SIGA | 0.00 |
First quarter earnings spark fresh look at SIGA Technologies
SIGA Technologies (SIGA) has drawn fresh attention after reporting first quarter 2026 results, with revenue of US$6.24 million and a net loss of US$3.45 million, compared with the same period a year earlier.
The 1-day share price return of 2.11% and 7-day move down 13.12% leave SIGA trading at US$4.17, with the 1-year total shareholder return also down 21.30%, suggesting momentum has been fading despite previous multi year resilience.
If this earnings reaction has you reassessing your watchlist, it could be a good moment to look at other opportunities, including 32 healthcare AI stocks
With first quarter figures showing lower revenue and a wider loss, and the stock down over multiple timeframes yet trading at an estimated 11% discount to intrinsic value, is this weakness a potential entry point or is the market already pricing in future growth?
Preferred P/E of 14.8x: Is it justified?
On a P/E of 14.8x compared with a last close of $4.17, SIGA screens as good value against peers, even though the share price has been under pressure.
The P/E multiple compares what investors are currently paying for each dollar of earnings. For a commercial stage pharmaceutical company with high quality earnings, this is a commonly used yardstick because it links directly to current profitability.
Here, SIGA trades on a P/E of 14.8x while the peer average sits at 48.6x, indicating the stock is priced well below what similar companies command. The estimated fair P/E of 49.7x is also far above the current level, suggesting a valuation gap that the market could move toward if expectations align more closely with those implied by this fair ratio.
Result: Price-to-earnings of 14.8x (UNDERVALUED)
However, you still need to weigh concentration in a single product and the recent share price slide of 33.5% year to date as potential pressure points.
Another way to look at value
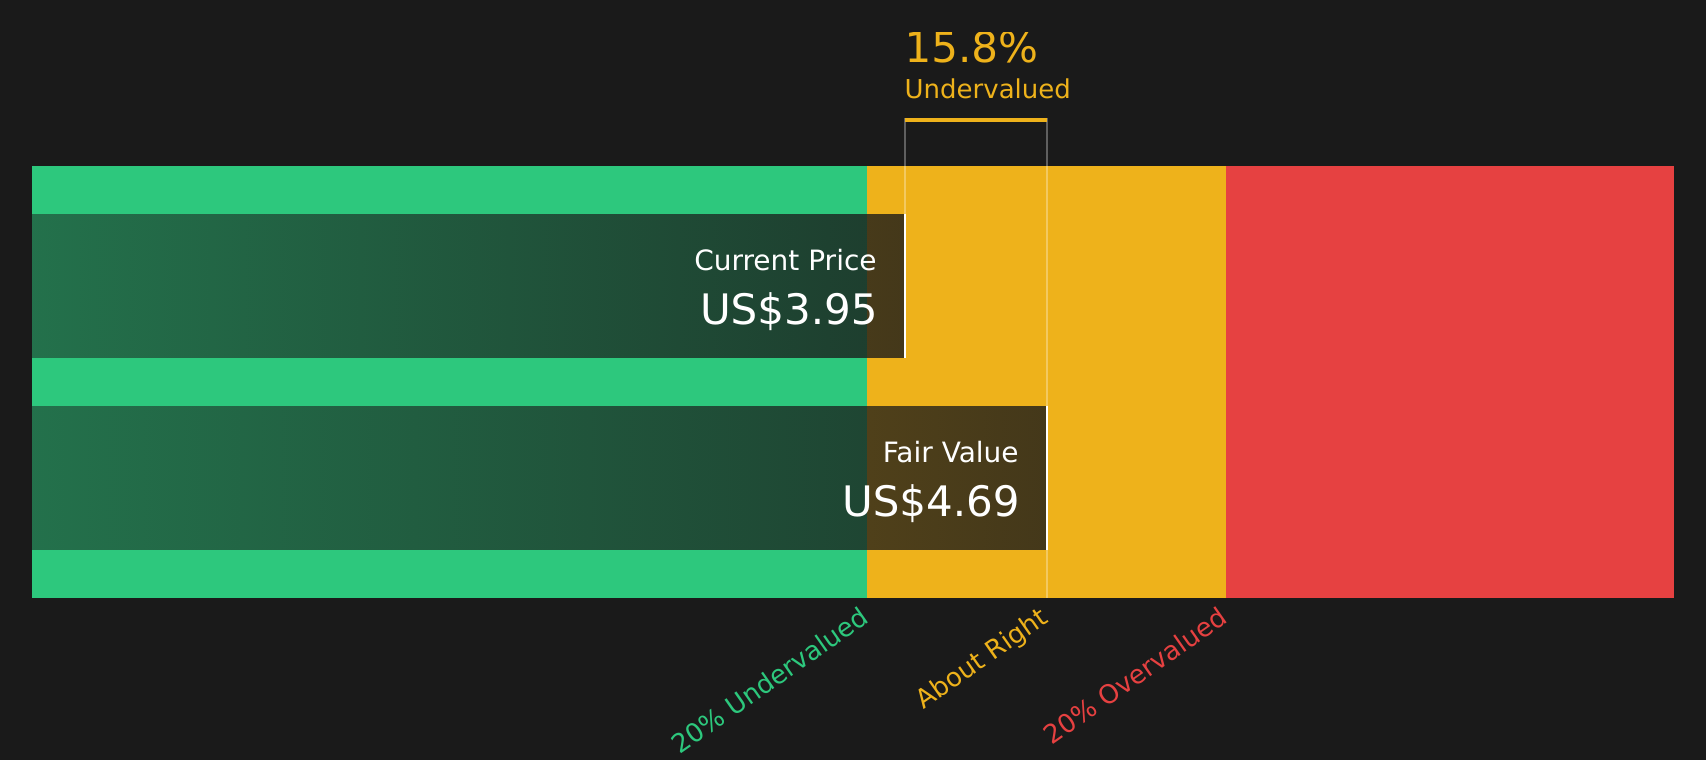
While the current P/E of 14.8x suggests SIGA looks cheap against peers and its fair ratio, the SWS DCF model paints a more measured picture. With an estimated future cash flow value of $4.69 versus a share price of $4.17, the discount sits at roughly 11%. That is a smaller margin of safety. Which signal do you treat as the anchor?
Simply Wall St performs a discounted cash flow (DCF) on every stock in the world every day (check out SIGA Technologies for example). We show the entire calculation in full. You can track the result in your watchlist or portfolio and be alerted when this changes, or use our stock screener to discover 51 high quality undervalued stocks. If you save a screener we even alert you when new companies match - so you never miss a potential opportunity.
Next Steps
Given the mixed signals in the data, are you seeing more risk or more reward here, and how quickly do you want to decide for yourself? To weigh both sides before you act, start by reviewing the 2 key rewards and 1 important warning sign.
Looking for more investment ideas?
If SIGA has your attention, do not stop here. Use the Simply Wall St screener to line up other stocks that fit what you are really looking for.
- Target higher income potential by reviewing companies in the 13 dividend fortresses that currently offer substantial yields with an emphasis on resilience.
- Spot potential value opportunities early by scanning the screener containing 21 high quality undiscovered gems that combine strong fundamentals with under-the-radar profiles.
- Keep risk in check by focusing on the 65 resilient stocks with low risk scores so you can build a watchlist that prioritises steadier return profiles.
This article by Simply Wall St is general in nature. We provide commentary based on historical data and analyst forecasts only using an unbiased methodology and our articles are not intended to be financial advice. It does not constitute a recommendation to buy or sell any stock, and does not take account of your objectives, or your financial situation. We aim to bring you long-term focused analysis driven by fundamental data. Note that our analysis may not factor in the latest price-sensitive company announcements or qualitative material. Simply Wall St has no position in any stocks mentioned.