A Look At Sportradar Group (NasdaqGS:SRAD) Valuation After New NBC Sports And AI Integrity Initiatives
Sportradar Group AG Class A SRAD | 16.95 | +1.92% |
Sportradar Group (NasdaqGS:SRAD) is back in focus after announcing a multi-year deal with NBC Sports Regional Sports Networks that brings its NBA Advanced Data and AI-driven GameFrame graphics into live NBA broadcasts.
Despite the fresh NBC Sports deal and progress in its AI driven fraud detection and integrity programs, Sportradar Group’s recent share price momentum has been weak, with a 30 day share price return of 18.25% and a year to date share price return of 29.89%, while the 3 year total shareholder return of 29.35% shows a stronger longer term picture.
If this NBA broadcast agreement has you thinking about where AI and data are heading next, you might want to scan our list of 58 profitable AI stocks that aren't just burning cash as another set of ideas to review.
With Sportradar shares down over the past year despite revenue and net income growth, and trading below some estimates of intrinsic value, you have to ask: is there a genuine opportunity here, or is the market already pricing in future growth?
Most Popular Narrative: 49.6% Undervalued
At a last close of $16.35 versus a narrative fair value of $32.46, Sportradar Group is framed as significantly mispriced, with that view resting on a detailed long term earnings and margin story.
Increasing demand for advanced, real time sports data, in play betting, and micro markets is driving greater adoption of premium, higher margin products like MTS and 4Sight, supporting both revenue acceleration and EBITDA margin expansion.
Curious how recurring data contracts, projected earnings growth and a richer margin profile combine to justify that gap? The full narrative lays out the revenue runway, the profitability bridge and the valuation multiple that connect today’s price to that higher fair value.
Result: Fair Value of $32.46 (UNDERVALUED)
However, higher discount rate assumptions and concerns about margin pressure from spending on AI, technology and acquisitions could challenge that upside story if they have a greater impact than expected.
Another Angle: Earnings Multiple Looks Stretched
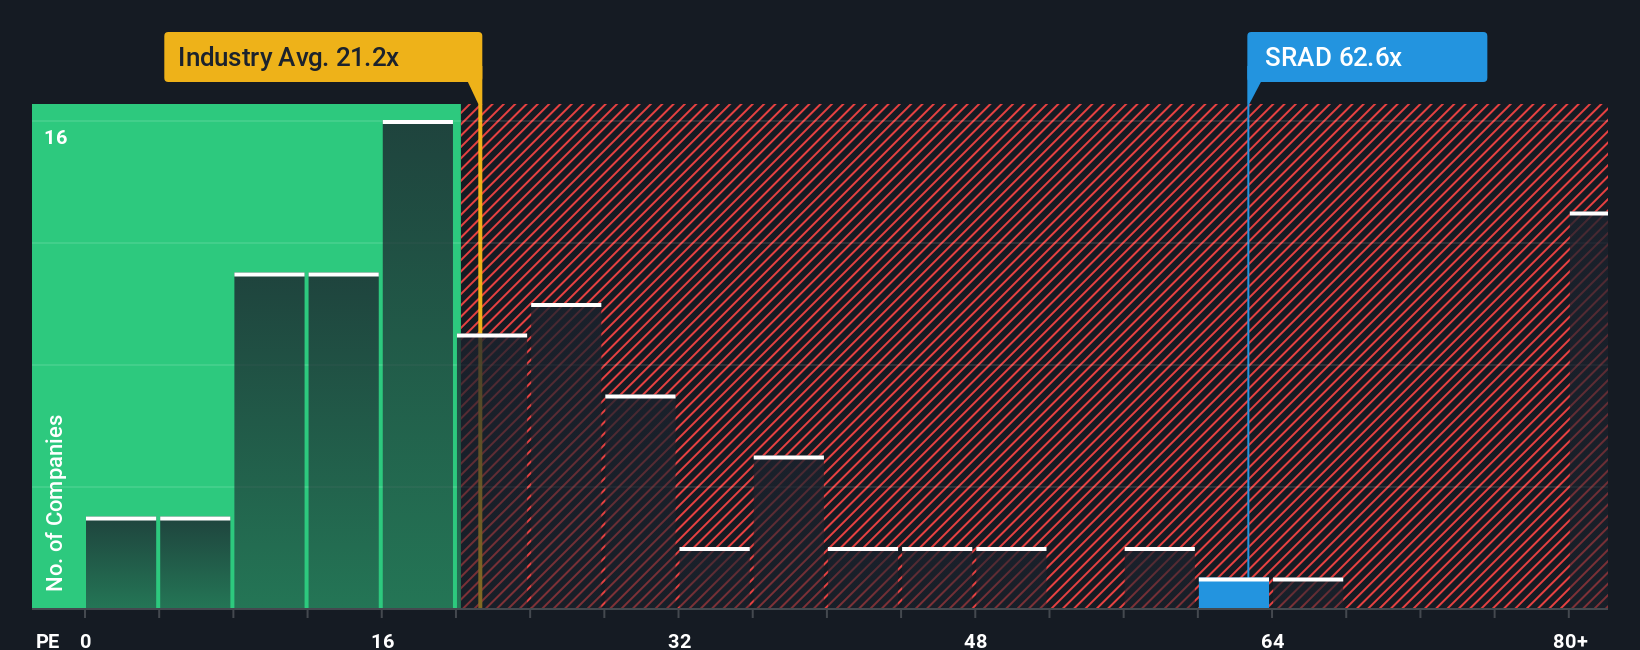
The first narrative leans heavily on cash flows and a long term earnings ramp to argue Sportradar looks cheap. On a simple earnings multiple, though, the picture is tougher: the stock trades on a P/E of 43.4x versus 21.7x for the US Hospitality industry, 26.5x for peers, and a fair ratio of 28.6x. That kind of gap can signal plenty of optimism already in the price. How comfortable are you with paying such a premium for the growth story?
To see how this premium stacks up in detail and what the numbers imply for risk, See what the numbers say about this price — find out in our valuation breakdown. can help you compare where the ratio sits today versus where the market could move over time.
Build Your Own Sportradar Group Narrative
If you are not fully on board with this storyline or simply prefer to rely on your own work, you can stress test the numbers yourself and shape a fresh thesis in just a few minutes, then Do it your way.
A good starting point is our analysis highlighting 4 key rewards investors are optimistic about regarding Sportradar Group.
Looking for more investment ideas?
You have already done the hard work by digging into Sportradar, so do not stop short when there are other opportunities you can quickly scan and compare.
- Spot potential bargains early by reviewing our list of screener containing 23 high quality undiscovered gems that pair solid fundamentals with under the radar profiles.
- Strengthen your core holdings by considering companies from the solid balance sheet and fundamentals stocks screener (45 results) that focus on financial resilience and consistent execution.
- Target steadier return profiles by checking out the 85 resilient stocks with low risk scores that may help you balance bolder positions in your portfolio.
This article by Simply Wall St is general in nature. We provide commentary based on historical data and analyst forecasts only using an unbiased methodology and our articles are not intended to be financial advice. It does not constitute a recommendation to buy or sell any stock, and does not take account of your objectives, or your financial situation. We aim to bring you long-term focused analysis driven by fundamental data. Note that our analysis may not factor in the latest price-sensitive company announcements or qualitative material. Simply Wall St has no position in any stocks mentioned.