A Look At St. Joe (JOE) Valuation As P/E And DCF Send Mixed Signals
St. Joe Company JOE | 0.00 |
Why St. Joe is on investors’ radar today
St. Joe (JOE) is drawing attention as investors reassess its real estate and hospitality focused model, with the stock recently closing at $65.05 and an indicated intrinsic discount of 44.3%.
Recent trading shows mixed momentum, with a 7 day share price return of 0.74% set against a 90 day share price decline of 5.12%. At the same time, the 1 year total shareholder return of 47.95% and 3 year total shareholder return of 57.53% indicate stronger performance over longer periods.
If St. Joe’s run has you rethinking your watchlist, this could be a good moment to look beyond real estate and check out 18 top founder-led companies
With St. Joe trading at $65.05 and an indicated intrinsic discount of 44.3%, the big question is whether the stock is still undervalued or if the market is already pricing in future growth and execution, leaving little room for a clear buying opportunity.
Price-to-Earnings of 33.6x: Is it justified?
St. Joe trades on a P/E of 33.6x, which sits well above both the US Real Estate industry average of 26.5x and the peer average of 15.9x, even as the stock last closed at $65.05.
The P/E multiple reflects how much investors are currently willing to pay for each dollar of earnings. For a real estate development and hospitality company like St. Joe, a higher P/E often hints that the market is paying up for current profitability, the quality of earnings, or expectations around future cash generation rather than just today’s reported profit.
Here, the strong recent earnings profile stands out. Earnings grew by 44.2% over the past year, ahead of the company’s own 5 year earnings growth rate of 9.8% per year and ahead of the US Real Estate industry, which recorded a 0.6% decline. Net profit margins are 21.6%, compared with 19% last year, and earnings are described as high quality, which may help explain why the market is willing to assign a richer multiple despite a return on equity of 14.5% that is flagged as low.
Relative to peers, the premium is clear. A 33.6x P/E is higher than the US Real Estate industry average of 26.5x and more than double the peer average of 15.9x, which suggests investors are pricing St. Joe differently to many other stocks in the sector.
Result: Price-to-Earnings of 33.6x (OVERVALUED)
However, the high 33.6x P/E and concentration in US real estate and hospitality mean any slowdown in demand or earnings disappointment could quickly challenge today’s premium.
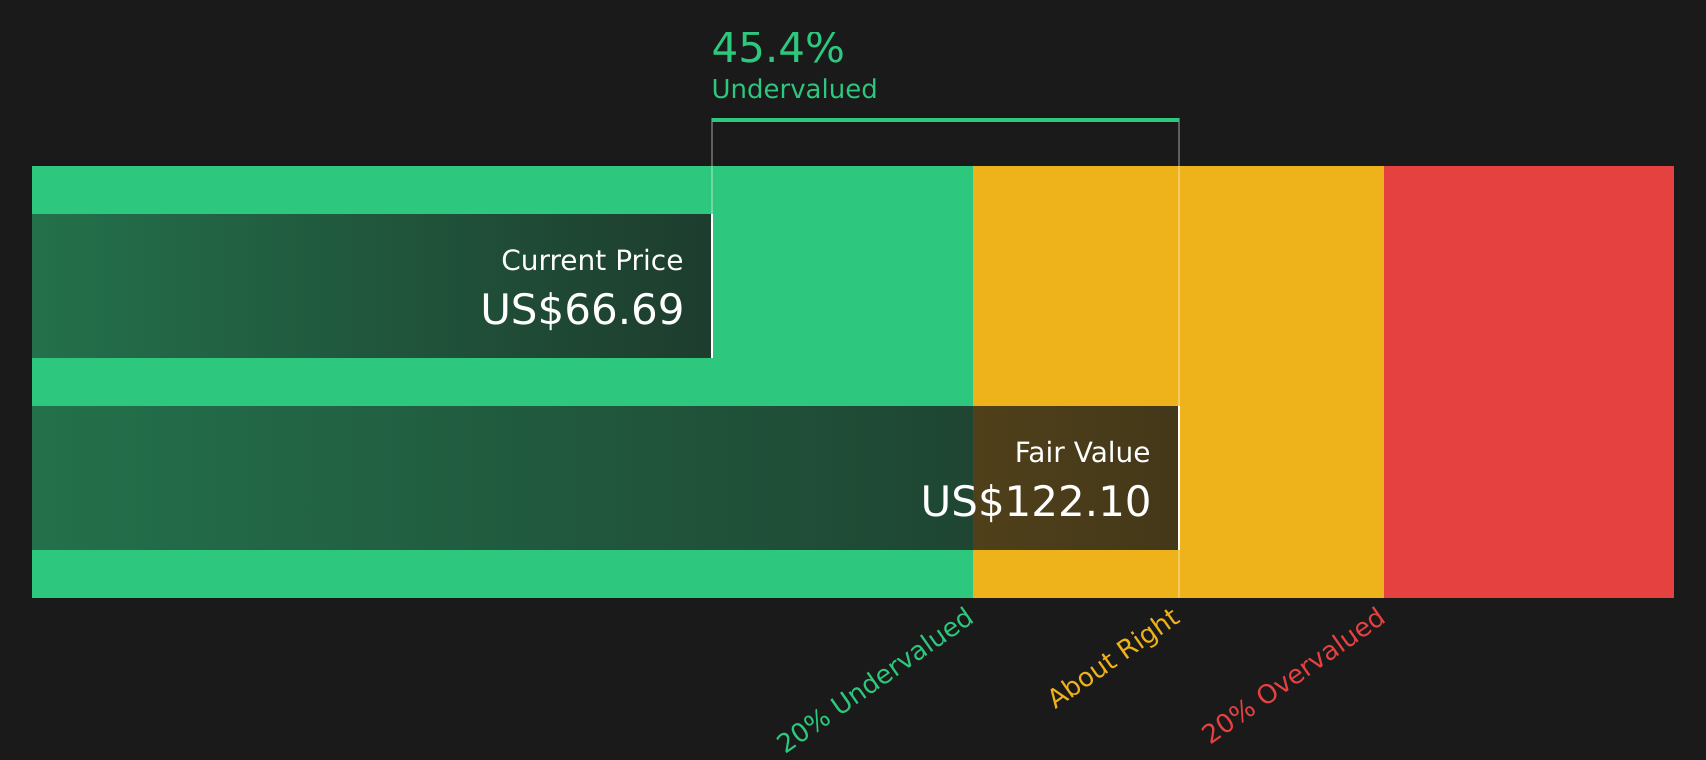
Another view on value: what the DCF says
While the 33.6x P/E ratio flags St. Joe as expensive next to the US Real Estate industry at 26.5x and peers at 15.9x, the SWS DCF model points the other way. With the stock at $65.05 against an estimated future cash flow value of $118.10, it screens as undervalued.
The two methods are telling very different stories. The real question for you is which signal you trust more: the earnings multiple or the cash flow model.
Simply Wall St performs a discounted cash flow (DCF) on every stock in the world every day (check out St. Joe for example). We show the entire calculation in full. You can track the result in your watchlist or portfolio and be alerted when this changes, or use our stock screener to discover 52 high quality undervalued stocks. If you save a screener we even alert you when new companies match - so you never miss a potential opportunity.
Next Steps
Conflicted by the mixed signals so far? Take a closer look at the numbers, weigh the risks against the potential rewards, and then check 2 key rewards and 1 important warning sign
Looking for more investment ideas?
If St. Joe has caught your attention, do not stop here. Broaden your watchlist now so you are not late to the next opportunity.
- Target value opportunities by scanning for companies that combine quality and attractive pricing using the 52 high quality undervalued stocks
- Strengthen your income focus by reviewing stocks that feature resilient payouts in the 12 dividend fortresses
- Seek out underfollowed stories with solid fundamentals through the screener containing 24 high quality undiscovered gems
This article by Simply Wall St is general in nature. We provide commentary based on historical data and analyst forecasts only using an unbiased methodology and our articles are not intended to be financial advice. It does not constitute a recommendation to buy or sell any stock, and does not take account of your objectives, or your financial situation. We aim to bring you long-term focused analysis driven by fundamental data. Note that our analysis may not factor in the latest price-sensitive company announcements or qualitative material. Simply Wall St has no position in any stocks mentioned.