A Look At Standex International (SXI) Valuation After Organic Growth And Mixed Profitability In Recent Results
Standex International Corporation SXI | 0.00 |
Standex International (SXI) is back on investor radar after reporting year-on-year organic revenue growth, driven by new product launches and demand from electrical grid, space, defense, and aviation customers, despite missing some profitability estimates.
Those growth headlines are lining up with strong recent market interest, with a 30.03% year to date share price return and a 95.00% total shareholder return over the past year suggesting momentum has been building rather than fading.
If Standex’s move has you looking at other industrial and infrastructure themes, this could be a good moment to scan for opportunities in 33 power grid technology and infrastructure stocks
With the stock up sharply over 1 year and trading slightly above the current analyst price target of $290.80, the bigger question now is whether Standex still trades at a discount or if the market is already pricing in future growth.
Most Popular Narrative: 0.5% Overvalued
Standex’s last close at $292.39 sits just above the most followed fair value estimate of $290.80, which is built on detailed revenue and earnings forecasts.
The accelerating global shift towards automation, electrification, and grid modernization is driving persistent demand for Standex's high-value electrical, sensor, and precision engineering solutions, creating a runway for double-digit sales increases in fast growth end markets and supporting sustained above-GDP revenue growth.
Ongoing digital transformation in industrial sectors and the proliferation of IoT applications are expanding the need for custom sensors and embedded technologies; Standex's ramped-up R&D and layered new product launches are expected to compound organic growth and provide higher-margin revenue streams, underpinning multi-year operating and net margin expansion.
Curious what sits behind that near match between price and fair value? The narrative leans on specific revenue growth paths, margin shifts, and a future earnings multiple that could surprise you when you see the full set of assumptions.
Result: Fair Value of $290.80 (OVERVALUED)
However, the picture could change quickly if acquisition driven growth masks weaker organic demand or if trade and tariff pressures further squeeze costs and margins.
Another Take: Cash Flows Point the Other Way
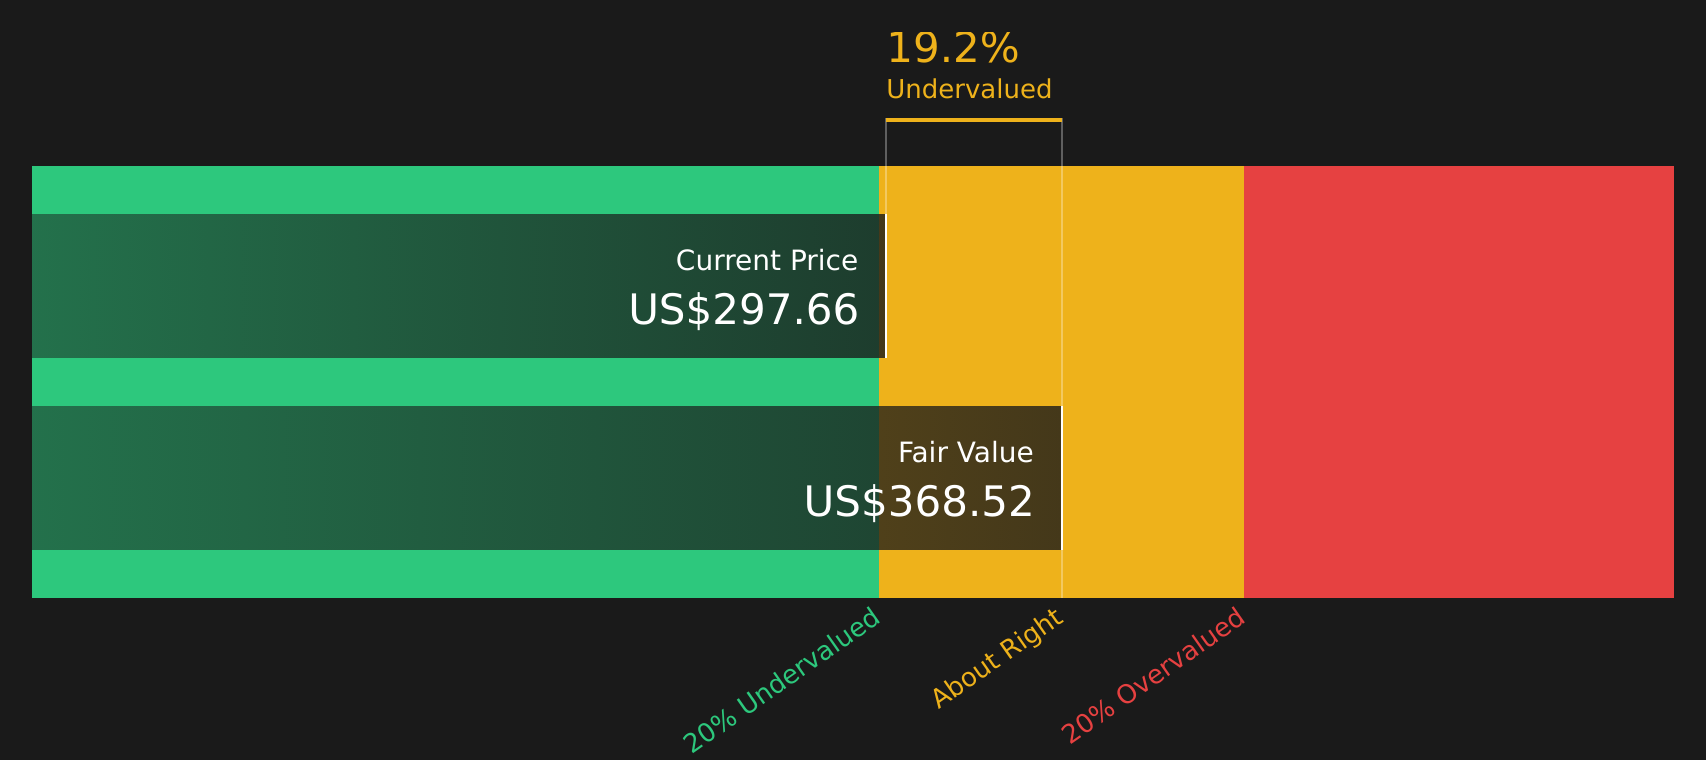
While the consensus fair value built on earnings forecasts calls Standex slightly overvalued at $290.80, the SWS DCF model paints a different picture, with a future cash flow value of $361.59. If cash flows matter more than the current P/E, is the market underpricing the long game?
For a closer look at how those cash flow assumptions are stitched together, it is worth checking how the SWS DCF model treats revenue growth, margins, and discount rates over time. Then compare that to your own expectations for the business. Look into how the SWS DCF model arrives at its fair value.
Simply Wall St performs a discounted cash flow (DCF) on every stock in the world every day (check out Standex International for example). We show the entire calculation in full. You can track the result in your watchlist or portfolio and be alerted when this changes, or use our stock screener to discover 47 high quality undervalued stocks. If you save a screener we even alert you when new companies match - so you never miss a potential opportunity.
Next Steps
With fair value signals pulling in different directions, it makes sense to move quickly, review the full picture, and decide where you stand on Standex’s mix of concerns and positives by checking the 3 key rewards and 2 important warning signs
Looking for more investment ideas?
Do not stop with just one stock. Use the tools available to compare different opportunities side by side so you can focus your energy where it really counts.
- Target reliable income by scanning for companies that might support stronger payouts with the 10 dividend fortresses
- Hunt for quality at a potential discount using the 47 high quality undervalued stocks
- Prioritize resilience and capital protection by checking stocks that appear sturdier on key risk metrics through the 63 resilient stocks with low risk scores
This article by Simply Wall St is general in nature. We provide commentary based on historical data and analyst forecasts only using an unbiased methodology and our articles are not intended to be financial advice. It does not constitute a recommendation to buy or sell any stock, and does not take account of your objectives, or your financial situation. We aim to bring you long-term focused analysis driven by fundamental data. Note that our analysis may not factor in the latest price-sensitive company announcements or qualitative material. Simply Wall St has no position in any stocks mentioned.