A Look At Stifel Financial (SF) Valuation After Earnings Beat Dividend Hike And Stock Split Announcement
Stifel Financial Corp SF | 74.07 | +0.12% |
Stifel Financial (SF) is back in focus after reporting Q4 2025 results that topped market expectations, along with record full year revenue and an 11% dividend increase paired with a three-for-two stock split.
Those Q4 beats, record 2025 revenue and the 11% dividend increase come after a mixed share price run. The 90 day share price return is 3.98%, but the 7 day share price return shows a 3.60% decline. The latest price of $124.18 sits against a 1 year total shareholder return of 11.88% and a 5 year total shareholder return of 142.49%, suggesting long term holders have seen much stronger gains than recent traders.
If earnings momentum at Stifel has caught your attention, this can be a useful moment to scan other financial names and compare them with a broader set of fast growing stocks with high insider ownership.
With record revenue, an 11% higher dividend, an upcoming stock split and a recent share price pullback, is Stifel starting to look undervalued here, or has the market already priced in the next leg of growth?
Most Popular Narrative: 11.1% Undervalued
Against Stifel Financial's last close of $124.18, the most followed narrative sets fair value at $139.75, using a detailed cash flow and earnings framework to get there.
The ongoing investment in technology and adviser productivity tools is positioned to strengthen Stifel’s Global Wealth Management segment, potentially improving net margins by increasing efficiency and delivering tailored advice, enhancing future asset growth and stability.
Curious what kind of revenue path, margin uplift, and future P/E all have to line up to support that fair value gap? The narrative leans on meaningful profitability assumptions, a smaller valuation multiple than many peers, and a specific growth runway in Global Wealth Management. The details matter, and they are sharper than a simple top line forecast.
Result: Fair Value of $139.75 (UNDERVALUED)
However, there are still clear swing factors, including prolonged market volatility and any further legal expenses, that could pressure margins and challenge the current earnings story.
Another View: Cash Flows Point A Different Way
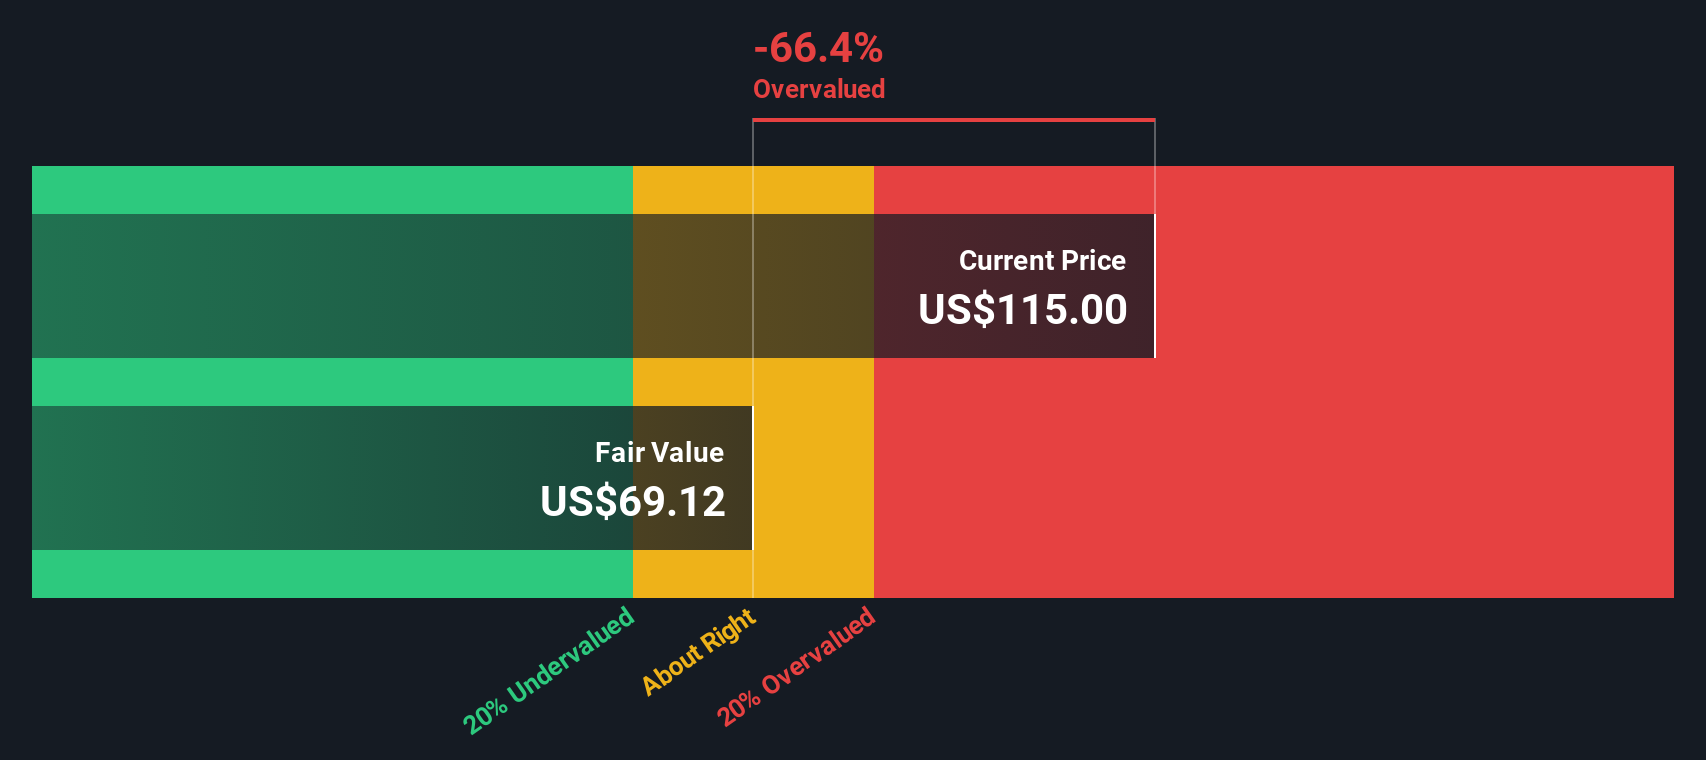
That 11.1% undervalued fair value at $139.75 leans heavily on earnings, margins and a lower future P/E. Our DCF model, which prices Stifel at $105.61 based on projected cash flows, instead flags the shares as overvalued at the current $124.18. Which story do you feel fits your expectations better?
Simply Wall St performs a discounted cash flow (DCF) on every stock in the world every day (check out Stifel Financial for example). We show the entire calculation in full. You can track the result in your watchlist or portfolio and be alerted when this changes, or use our stock screener to discover 876 undervalued stocks based on their cash flows. If you save a screener we even alert you when new companies match - so you never miss a potential opportunity.
Build Your Own Stifel Financial Narrative
If your view of Stifel’s future looks different to these narratives, you can analyze the same data and shape your own story in just a few minutes with Do it your way.
A good starting point is our analysis highlighting 2 key rewards investors are optimistic about regarding Stifel Financial.
Looking for more investment ideas?
If Stifel does not fully match your style, do not stop here. Broaden your watchlist with focused stock ideas built from clear financial filters.
- Spot early movers in smaller companies by scanning these 3542 penny stocks with strong financials that already show stronger balance sheets and fundamentals than many expect from low priced names.
- Explore the AI theme by checking these 24 AI penny stocks where artificial intelligence is central to the business model rather than just a marketing label.
- Review these 876 undervalued stocks based on cash flows that screen as attractively priced based on cash flows instead of headline stories alone.
This article by Simply Wall St is general in nature. We provide commentary based on historical data and analyst forecasts only using an unbiased methodology and our articles are not intended to be financial advice. It does not constitute a recommendation to buy or sell any stock, and does not take account of your objectives, or your financial situation. We aim to bring you long-term focused analysis driven by fundamental data. Note that our analysis may not factor in the latest price-sensitive company announcements or qualitative material. Simply Wall St has no position in any stocks mentioned.