A Look At TFS Financial (TFSL) Valuation After Recent Share Price Gains
TFS Financial Corporation TFSL | 0.00 |
Recent share performance and financial snapshot
TFS Financial (TFSL) has drawn investor attention after its stock returned 1.4% over the past week and about 2.1% over the past month, with year to date total return at 12.8%.
Over the past year, the stock’s total return is 23.9%, with a reported 3-year total return that is very large relative to its 5-year figure of 3.7%. The company last closed at US$15.31, giving it a market value of about US$4.27b.
The Cleveland based retail consumer bank reports annual revenue of US$335.0m and net income of US$91.6m. Recent annual figures show revenue growth of 6.6% and net income growth of 8.9%.
The 12.8% year-to-date share price return, together with a 23.9% 1-year total shareholder return and a very large 3-year total shareholder return, points to positive momentum building around TFS Financial as investors reassess its growth potential and risks.
If you are comparing TFS Financial with other opportunities in the market, this is a good moment to widen your research and check out 19 top founder-led companies
With TFSL trading close to its US$15.50 analyst price target and showing solid recent returns, the key question now is whether the current valuation leaves any upside or if the market is already pricing in future growth.
Price-to-Earnings of 46.6x: Is it justified?
At the last close of $15.31, TFS Financial is trading on a P/E of 46.6x, which looks expensive compared with both its peers and the wider US Banks industry.
The P/E ratio shows how much investors are paying for each dollar of current earnings and is a common way to compare banks. For TFSL, the current level suggests the market is putting a relatively high price on its earnings, even though TFSL is a mature retail consumer bank focused on US mortgage and deposit products.
TFSL is flagged as expensive versus its direct peer group average P/E of 11.3x and the broader US Banks industry average of 11.1x. The estimated fair P/E of 12.2x is also far lower than the current ratio, which may indicate a level the market could potentially move toward if expectations cool.
Result: Price-to-Earnings of 46.6x (OVERVALUED)
However, TFSL’s premium 46.6x P/E and its single segment focus on US retail consumer banking could quickly come under pressure if sentiment or credit conditions worsen.
Another view: DCF points to a very different price
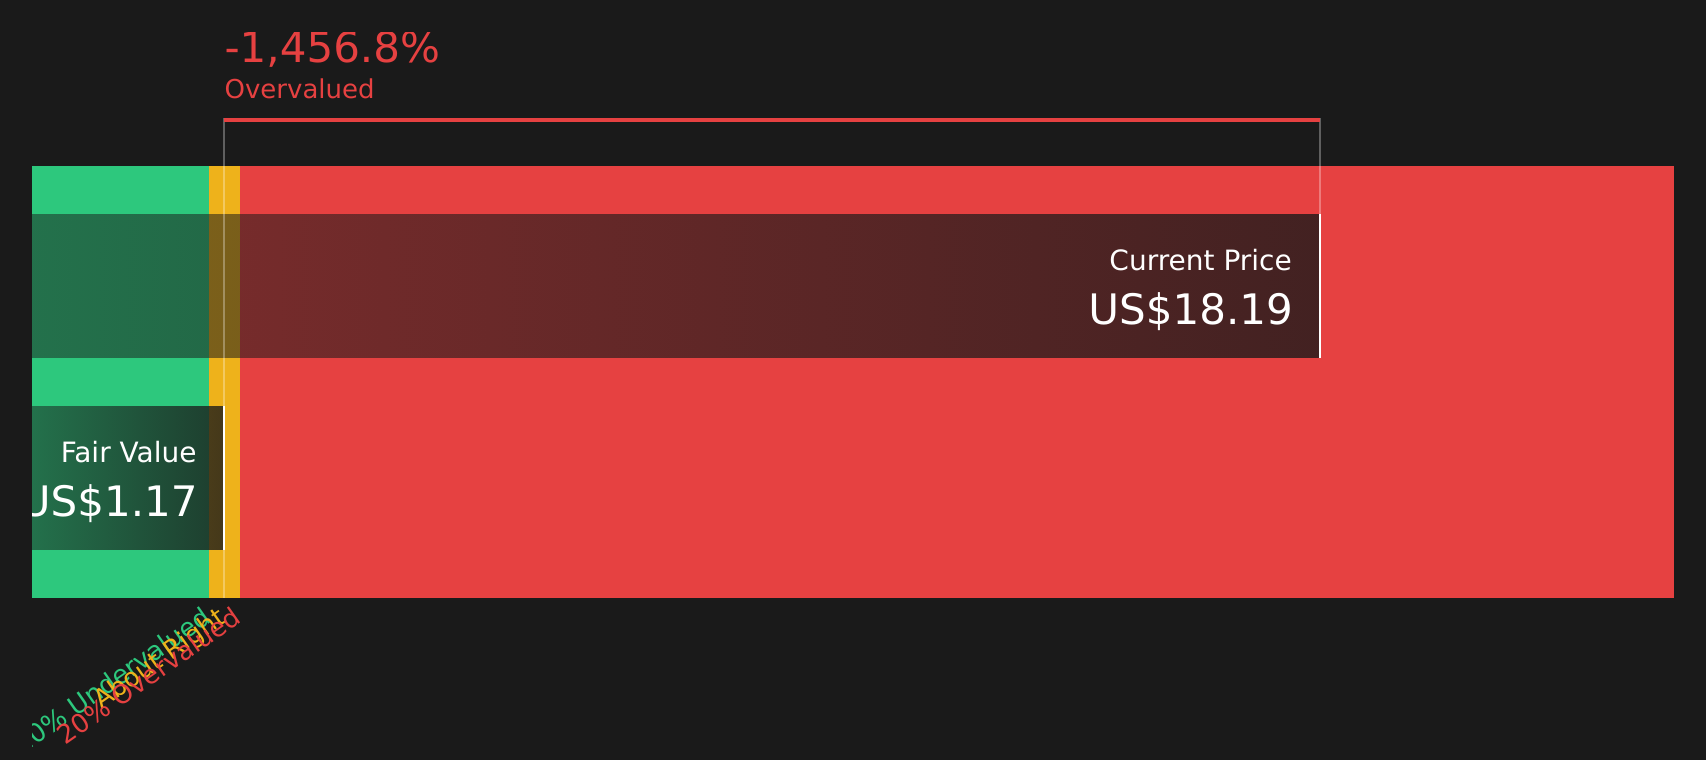
While the 46.6x P/E suggests a rich valuation versus peers, our DCF model points to an even starker gap, with an estimated future cash flow value of about $1.14 per share versus the current $15.31 price. This implies limited margin for error if sentiment shifts.
For a closer look at how this cash flow view is built, and what assumptions drive such a low figure relative to today’s price, Look into how the SWS DCF model arrives at its fair value.
Simply Wall St performs a discounted cash flow (DCF) on every stock in the world every day (check out TFS Financial for example). We show the entire calculation in full. You can track the result in your watchlist or portfolio and be alerted when this changes, or use our stock screener to discover 51 high quality undervalued stocks. If you save a screener we even alert you when new companies match - so you never miss a potential opportunity.
Next Steps
With such mixed signals on valuation and sentiment, this is a moment to look through the numbers yourself and decide how comfortable you are with the risk and reward balance. To see both sides laid out clearly, review the 2 key rewards and 1 important warning sign
Looking for more investment ideas?
If TFSL has sharpened your focus on valuation and quality, do not stop here. Broaden your watchlist with targeted stock ideas built from consistent, transparent data.
- Spot resilient balance sheets early and use the solid balance sheet and fundamentals stocks screener (45 results) to focus on companies that pair financial strength with grounded fundamentals.
- Hunt for potential value opportunities by scanning the 51 high quality undervalued stocks and see which stocks currently trade on what looks like a discounted profile.
- Round out your research with the 27 elite penny stocks with strong financials to see smaller companies that still pass key financial quality checks before they gain wider attention.
This article by Simply Wall St is general in nature. We provide commentary based on historical data and analyst forecasts only using an unbiased methodology and our articles are not intended to be financial advice. It does not constitute a recommendation to buy or sell any stock, and does not take account of your objectives, or your financial situation. We aim to bring you long-term focused analysis driven by fundamental data. Note that our analysis may not factor in the latest price-sensitive company announcements or qualitative material. Simply Wall St has no position in any stocks mentioned.