A Look At Toyota Industries (OTCPK:TYID.Y) Valuation After FTSE All World Index Removal
Index removal puts Toyota Industries (OTCPK:TYID.Y) back in focus
Toyota Industries (OTCPK:TYID.Y) was removed from the FTSE All-World Index (USD) on 31 May 2026. This type of change can prompt forced buying or selling by index-tracking funds and can shift short term trading flows.
At a share price of $124.78, the stock has a 1 day share price return of 2.93% around the index removal news. The year to date share price return of 10.08% contrasts with a 1 year total shareholder return of 2.79%, while a 3 year total shareholder return of 84.64% points to momentum built over a longer horizon.
If shifts around Toyota Industries have you reassessing your watchlist, it can be useful to see what else is moving in automation and materials handling by checking 33 robotics and automation stocks.
With Toyota Industries trading on an intrinsic value premium of around 10% and a mixed recent return profile, the key question is simple: are you looking at a new entry point, or a stock where markets are already banking on future growth?
Price to earnings of 26.8x: Is it justified?
The current picture is that Toyota Industries trades on a P/E of 26.8x, very slightly above the US Machinery industry average of 26.7x and only a touch above an estimated fair P/E of 26.3x. The last close sits at $124.78 and the stock trades at an intrinsic value premium of around 10%.
The P/E ratio links the share price to earnings per share, so it gives you a quick sense of how much you are paying for each dollar of profit. For a diversified industrial group like Toyota Industries, with exposure to materials handling equipment, automobiles and textile machinery, it is one of the more widely used ways investors compare it to peers in the same sector.
The company currently reports a Return on Equity of 3.3%, which is described as low, and earnings over the past year declined 14.7%, even though earnings over the past 5 years have grown by 7.2% per year. Against that backdrop, a P/E of 26.8x that sits just above both the industry average and the 26.3x fair P/E estimate suggests the market is not pricing in a discount for recent earnings pressure. Instead, the stock is being kept on roughly peer-level multiples, which could move closer to that fair ratio over time.
Compared with the broader US Machinery industry, Toyota Industries screens as slightly more expensive on this P/E measure, even though its 1 year return has lagged both the industry and the wider US market. The fact that the P/E also sits a little above the estimated fair P/E of 26.3x underlines that investors are not treating this as a clear bargain on earnings, but rather as a stock valued close to what the numbers suggest the multiple should be.
Result: Price-to-earnings of 26.8x (OVERVALUED).
However, the relatively low 3.3% Return on Equity and earnings that declined 14.7% over the past year could challenge the case for paying a 10% intrinsic premium.
Another view on value
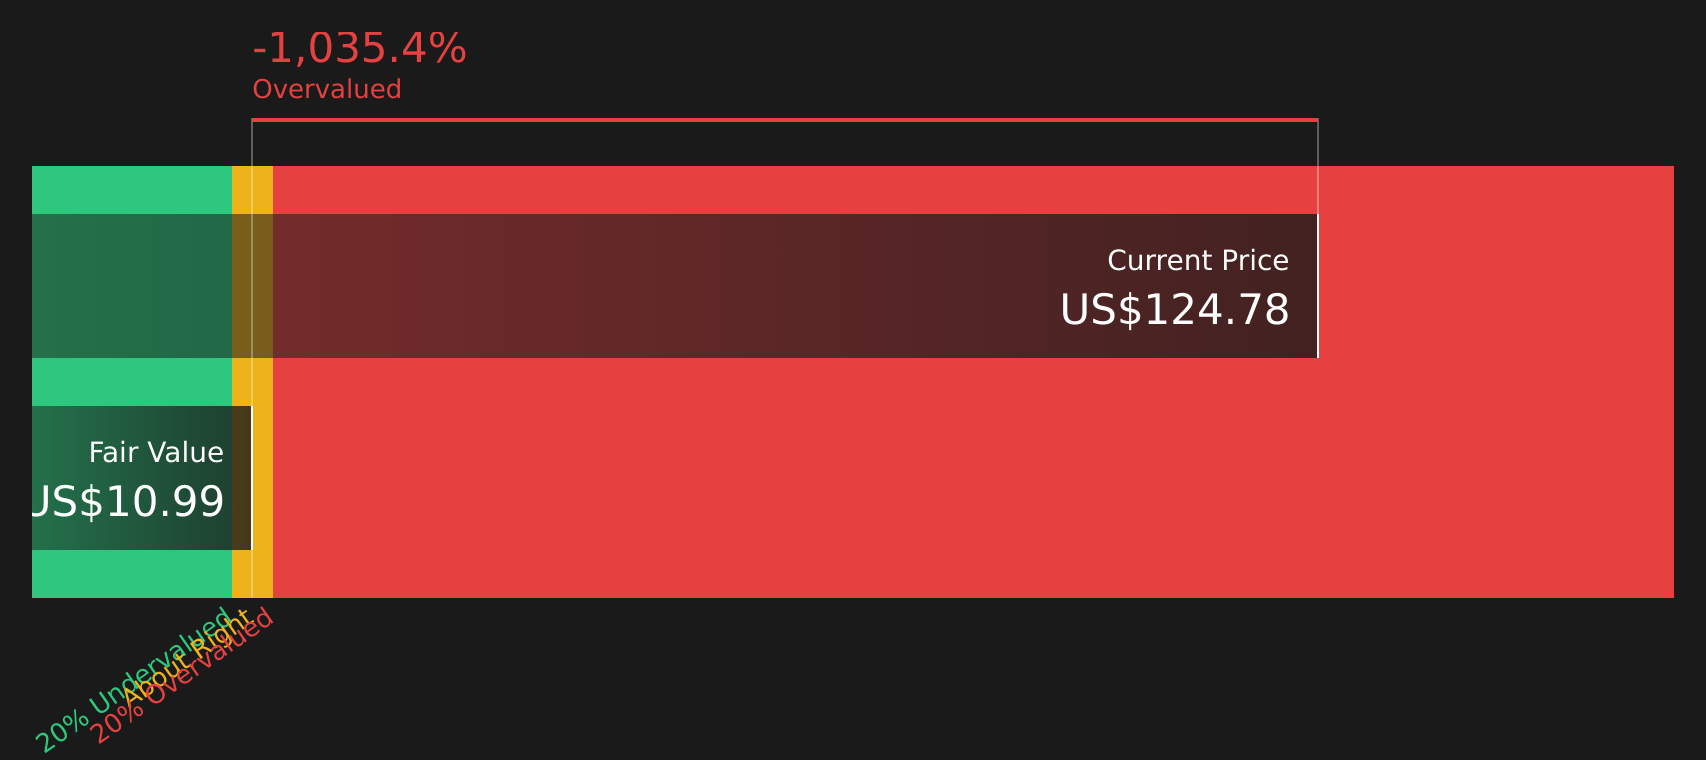
On a P/E basis, Toyota Industries looks only slightly expensive, but the SWS DCF model paints a very different picture. At a share price of $124.78 versus an estimated future cash flow value of $10.99, the stock screens as heavily overvalued using this cash flow lens. That leaves you weighing how much faith to put in earnings multiples versus long range cash flow assumptions.
Simply Wall St performs a discounted cash flow (DCF) on every stock in the world every day (check out Toyota Industries for example). We show the entire calculation in full. You can track the result in your watchlist or portfolio and be alerted when this changes, or use our stock screener to discover 49 high quality undervalued stocks. If you save a screener we even alert you when new companies match - so you never miss a potential opportunity.
Next Steps
Looking for more investment ideas?
If this kind of valuation check has you thinking bigger about your portfolio, now is a good time to scan for other stocks that fit your style.
Use the Simply Wall St Screener to quickly sort companies by quality, value and risk, and avoid missing out on ideas that match your checklist.
- Target resilient cash generators with strong fundamentals by running the solid balance sheet and fundamentals stocks screener (46 results).
- Hunt for opportunities that combine quality with attractive pricing using the 49 high quality undervalued stocks.
- Spot under the radar prospects before wider attention arrives through the screener containing 21 high quality undiscovered gems.
This article by Simply Wall St is general in nature. We provide commentary based on historical data and analyst forecasts only using an unbiased methodology and our articles are not intended to be financial advice. It does not constitute a recommendation to buy or sell any stock, and does not take account of your objectives, or your financial situation. We aim to bring you long-term focused analysis driven by fundamental data. Note that our analysis may not factor in the latest price-sensitive company announcements or qualitative material. Simply Wall St has no position in any stocks mentioned.