A Look At Transocean (RIG) Valuation After Recent Share Price Surge And Conflicting Fair Value Estimates
Transocean Ltd. RIG | 6.18 | +0.24% |
Transocean (RIG) has drawn attention after a sharp recent move in its share price, with returns of 8.46% over the past day and 20.22% over the past week, catching investor interest.
That sharp move comes on top of strong recent momentum, with a 30 day share price return of 54.61% and a year to date share price return of 54.25%, while the 1 year total shareholder return stands at 84.23% and the 3 year total shareholder return is negative. This means short term strength contrasts with a weaker longer term record.
If this kind of price swing has your attention, it could be a good moment to see what else is moving in the sector and check out 24 power grid technology and infrastructure stocks as another potential hunting ground.
With Transocean still loss making on US$3,874.0m of revenue and trading above the average analyst price target of US$5.14, you now have to ask: is there a genuine buying opportunity here, or is the market already pricing in future growth?
Most Popular Narrative: 50% Overvalued
With Transocean last closing at $6.54 against a narrative fair value of about $4.37, the most followed view sees the shares trading well ahead of its estimate, built on detailed assumptions about future contracts, profitability, and risk.
Transocean's industry-leading backlog (~$7 billion) with major E&P clients provides strong revenue visibility and cash flow stability, enabling efficient conversion of backlog into revenue and supporting rapid deleveraging, which will positively impact net debt levels and interest expense.
Curious what kind of profitability swing and future earnings multiple underpin that fair value cut, even while assuming shrinking revenues? The full narrative lays out the cash flow story, margin shift, and valuation bridge that have to line up to justify it.
Result: Fair Value of $4.37 (OVERVALUED)
However, there is still a chance that weaker crude prices or softer dayrates and utilization could hit cash flow, which would make Transocean's heavy debt load harder to manage.
Another Take: Cash Flows Point in a Different Direction
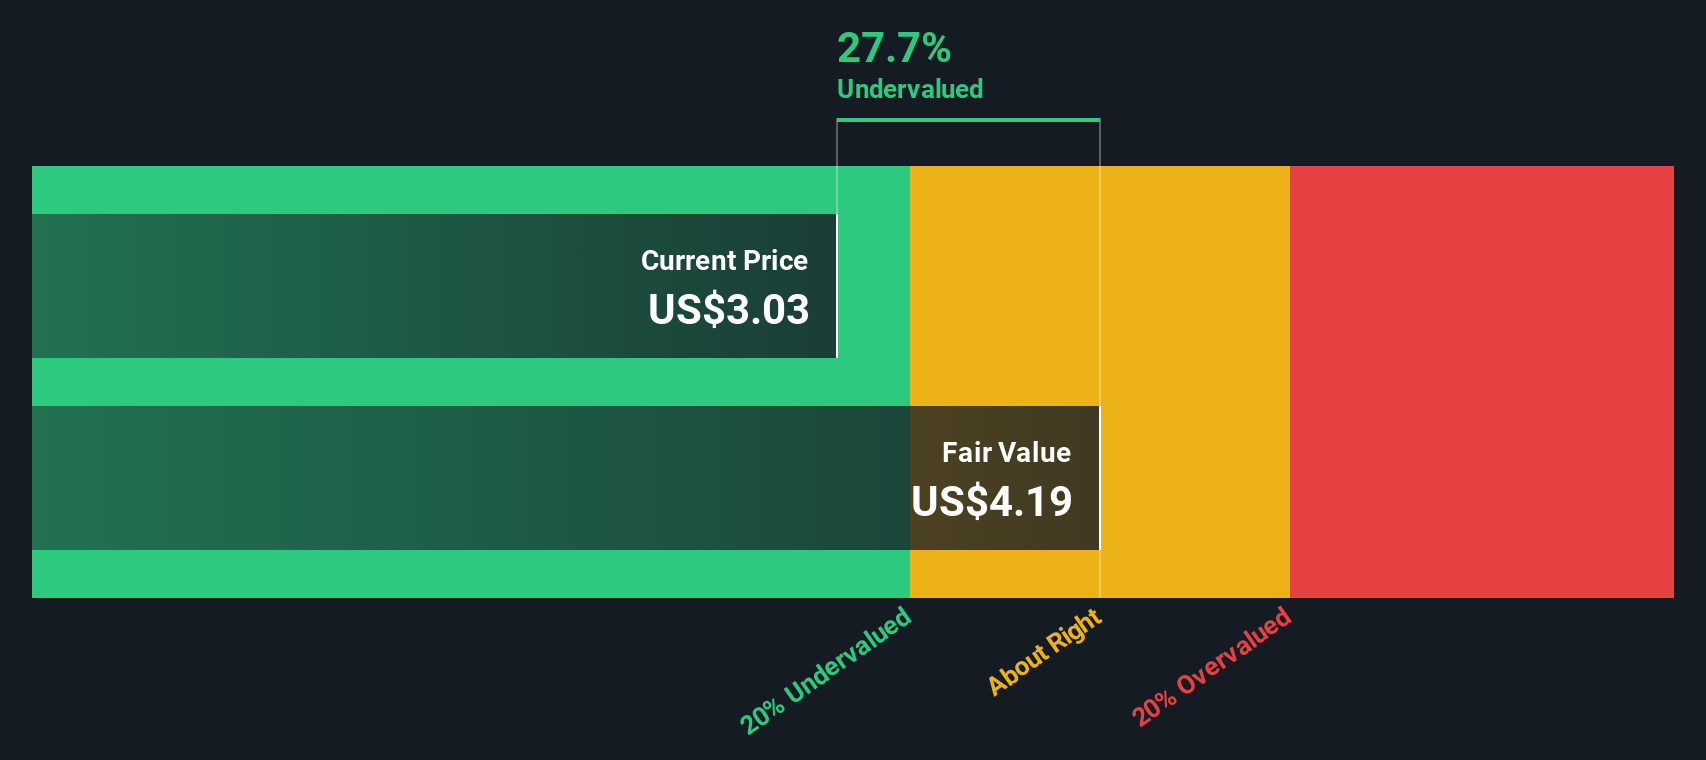
While the narrative fair value of about $4.37 suggests Transocean is overvalued, our DCF model points the other way. It indicates a future cash flow value of $7.11 per share, with the stock trading at $6.54. The question is which set of assumptions you trust more.
Simply Wall St performs a discounted cash flow (DCF) on every stock in the world every day (check out Transocean for example). We show the entire calculation in full. You can track the result in your watchlist or portfolio and be alerted when this changes, or use our stock screener to discover 55 high quality undervalued stocks. If you save a screener we even alert you when new companies match - so you never miss a potential opportunity.
Next Steps
The mix of strong recent returns, contrasting valuation models, and both risks and rewards around Transocean can feel conflicting, so it makes sense to look through the underlying data yourself and decide where you stand, especially with 2 key rewards and 2 important warning signs available to frame that view.
Looking for more investment ideas?
If Transocean has you thinking about what else might be worth your attention, now is the time to broaden your watchlist with a few focused stock ideas.
- Target reliable income streams by checking out dividend payers that stand out as 13 dividend fortresses built to support regular cash returns.
- Hunt for potential value opportunities with 55 high quality undervalued stocks that pair solid fundamentals with prices that may not fully reflect their quality.
- Prioritise resilience first and foremost and scan 81 resilient stocks with low risk scores that score well on financial strength and business risk.
This article by Simply Wall St is general in nature. We provide commentary based on historical data and analyst forecasts only using an unbiased methodology and our articles are not intended to be financial advice. It does not constitute a recommendation to buy or sell any stock, and does not take account of your objectives, or your financial situation. We aim to bring you long-term focused analysis driven by fundamental data. Note that our analysis may not factor in the latest price-sensitive company announcements or qualitative material. Simply Wall St has no position in any stocks mentioned.