A Look At VF (VFC) Valuation After Earnings Highlight Brand Strength And Ongoing Vans And International Challenges
V.F. Corporation VFC | 16.87 | -0.30% |
V.F (VFC) shares are in focus after the company reported quarterly results showing higher sales and profitability, with The North Face and Timberland helping offset ongoing weakness at Vans and pressure in international markets.
At a share price of US$21.18, V.F has seen short term momentum build, with a 7 day share price return of 10.83% and a 90 day share price return of 48.53%. However, its 1 year total shareholder return of 12.90% and 5 year total shareholder return of -69.04% show longer term holders still sit on sizeable losses as the market weighs recent earnings, leadership changes and ongoing international and Vans related pressures.
If V.F’s turnaround story has your attention, it could be a good moment to see what else is moving and check out fast growing stocks with high insider ownership.
VF now trades around intrinsic value estimates, with a value score of 1, a modest revenue growth rate and a recent swing back to profitability. Investors may wish to consider whether the market is already reflecting this reset or if there is still an opportunity at the current price.
Most Popular Narrative: 25% Overvalued
With V.F shares at $21.18 against a most-followed fair value estimate of $16.95, the current price sits above that narrative anchor, which hinges on specific earnings, margin and valuation assumptions.
The analysts have a consensus price target of $15.19 for V.F based on their expectations of its future earnings growth, profit margins and other risk factors. However, there is a degree of disagreement amongst analysts, with the most bullish reporting a price target of $40.0, and the most bearish reporting a price target of just $10.0.
Want to see what justifies a fair value below today’s price? The core narrative leans on rising earnings, higher margins and a future earnings multiple that tightens meaningfully from here.
Result: Fair Value of $16.95 (OVERVALUED)
However, the story can shift quickly if Vans keeps seeing high single digit revenue declines or if tariff headwinds and elevated leverage continue to squeeze margins and cash generation.
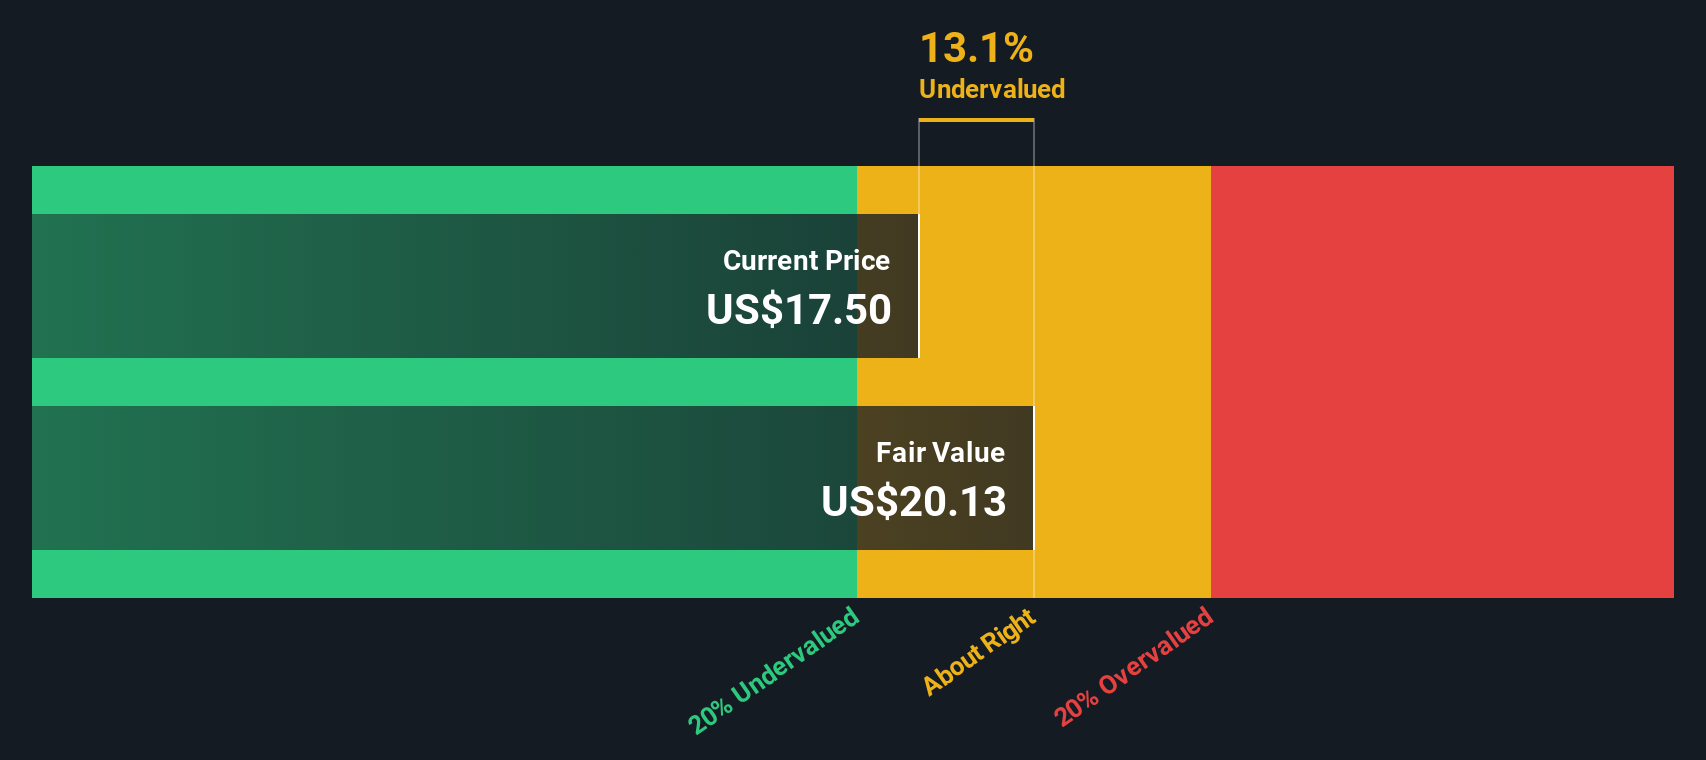
Another Angle: DCF Says Undervalued
While the popular narrative pins V.F’s fair value at $16.95 and labels the stock as overvalued, our DCF model points the other way, with an estimate of $25.02, about 15.3% above the current $21.18 share price. Which story do you think better fits the risks around Vans, leverage and margins?
Simply Wall St performs a discounted cash flow (DCF) on every stock in the world every day (check out V.F for example). We show the entire calculation in full. You can track the result in your watchlist or portfolio and be alerted when this changes, or use our stock screener to discover 868 undervalued stocks based on their cash flows. If you save a screener we even alert you when new companies match - so you never miss a potential opportunity.
Build Your Own V.F Narrative
If this view does not quite match your own, or you prefer to work straight from the numbers yourself, you can build a custom thesis in a few minutes with Do it your way.
A great starting point for your V.F research is our analysis highlighting 3 key rewards and 3 important warning signs that could impact your investment decision.
Looking for more investment ideas?
If you are serious about broadening your watchlist beyond V.F, use the Simply Wall Street Screener to quickly surface fresh ideas built from real fundamentals.
- Target potential mispricings by scanning for companies that look attractively priced on cash flows with these 868 undervalued stocks based on cash flows.
- Explore long term tech trends by checking out these 27 AI penny stocks that are tied to artificial intelligence themes.
- Strengthen your income watchlist by filtering for reliable payers through these 11 dividend stocks with yields > 3%.
This article by Simply Wall St is general in nature. We provide commentary based on historical data and analyst forecasts only using an unbiased methodology and our articles are not intended to be financial advice. It does not constitute a recommendation to buy or sell any stock, and does not take account of your objectives, or your financial situation. We aim to bring you long-term focused analysis driven by fundamental data. Note that our analysis may not factor in the latest price-sensitive company announcements or qualitative material. Simply Wall St has no position in any stocks mentioned.