A Look At WESCO International’s (WCC) Valuation After Its Recent Share Price Momentum
WESCO International, Inc. WCC | 277.45 | -1.77% |
What WESCO International’s recent share move signals for investors
WESCO International (WCC) recently closed at $307.10, with the stock showing mixed short term moves but positive returns over the past month, past 3 months, year to date, and past year.
The 3.9% 1 day share price gain to US$307.10 follows a choppy week but sits within a stronger trend, with an 11.0% 30 day share price return and a 57.4% 1 year total shareholder return suggesting momentum has been building rather than fading recently.
If this kind of move has you thinking about other ways to position around infrastructure and power demand, our screener of 25 power grid technology and infrastructure stocks is a useful place to start comparing ideas.
After a 57.4% 1-year total return and with the share price sitting close to its US$311.58 analyst target, at a small 1.5% discount, investors may be asking whether WESCO is still undervalued or if the market is already pricing in future growth.
Price-to-Earnings of 23.1x: Is it justified?
On a P/E of 23.1x and a last close of $307.10, WESCO International sits slightly above its peer average multiple but below the level our fair ratio suggests.
The P/E multiple simply compares the current share price to earnings per share, so it tells you how much investors are paying today for each dollar of earnings. For a distributor like WESCO, this often reflects expectations around steady demand, margins and how efficiently the business turns sales into profit over time.
Here, the picture is mixed. WESCO is described as expensive versus its peer average of 22.5x, and its earnings fell by 2.2% over the past year with net profit margins easing from 3% to 2.7%. At the same time, earnings have grown by 16.7% per year over the past five years. The estimated fair P/E of 30.6x is materially higher than the current 23.1x, a level the market could move toward if those longer term trends stay intact.
Compared with the broader US Trade Distributors industry, WESCO is flagged as good value on its current 23.1x P/E, which is just below the 23.6x industry average. That small discount to peers contrasts with the higher estimated fair P/E ratio. This highlights a gap between where the market is pricing the shares today and where the fair ratio analysis suggests they might sit.
Result: Price-to-Earnings of 23.1x (ABOUT RIGHT)
However, you still need to watch for pressure on WESCO’s 2.7% net margin and any slowdown from its 5.4% revenue growth that could challenge today’s P/E story.
Another lens on WESCO’s value
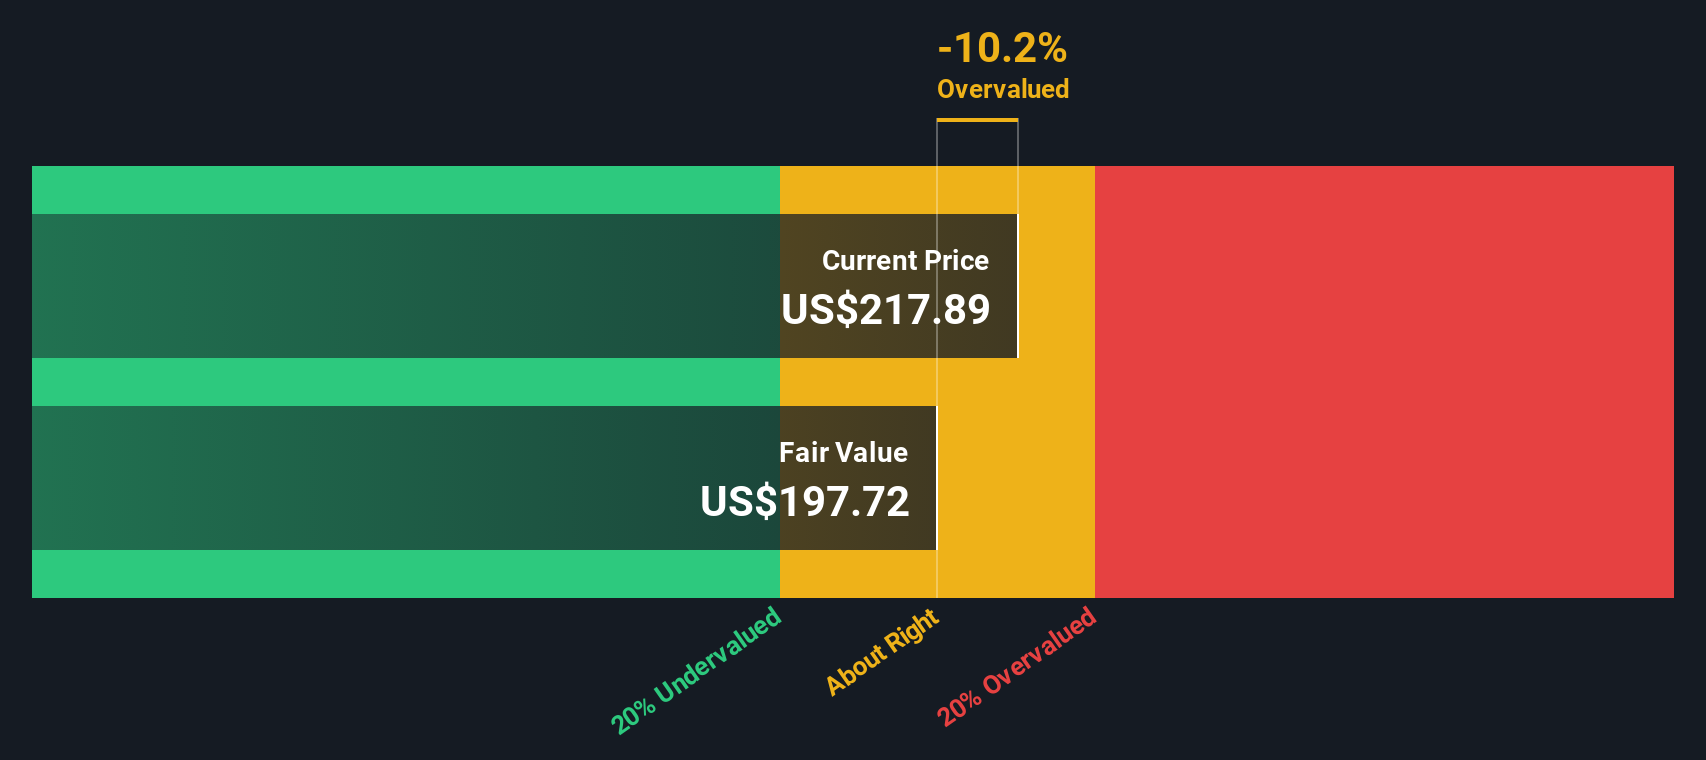
While the fair ratio suggests there could be room above today’s 23.1x P/E, our DCF model is slightly more cautious, with an estimated future cash flow value of $302.89 versus the current $307.10. This raises the question of whether the share price is already incorporating much of the positive information.
Simply Wall St performs a discounted cash flow (DCF) on every stock in the world every day (check out WESCO International for example). We show the entire calculation in full. You can track the result in your watchlist or portfolio and be alerted when this changes, or use our stock screener to discover 53 high quality undervalued stocks. If you save a screener we even alert you when new companies match - so you never miss a potential opportunity.
Build Your Own WESCO International Narrative
If your takeaway is different or you would rather rely on your own work, you can review the same data and build a custom view in just a few minutes, then Do it your way.
A great starting point for your WESCO International research is our analysis highlighting 2 key rewards and 1 important warning sign that could impact your investment decision.
Looking for more investment ideas?
If you are serious about tightening up your portfolio, do not stop with a single stock, use the Simply Wall St screener to surface new ideas efficiently.
- Target quality at a discount by reviewing 53 high quality undervalued stocks that combine strong fundamentals with prices that may not fully reflect their strengths.
- Strengthen your income stream by checking out 13 dividend fortresses that aim to pair higher yields with resilient business profiles.
- Dial back risk while staying invested by scanning 85 resilient stocks with low risk scores that score well on stability so you are not the one catching up later.
This article by Simply Wall St is general in nature. We provide commentary based on historical data and analyst forecasts only using an unbiased methodology and our articles are not intended to be financial advice. It does not constitute a recommendation to buy or sell any stock, and does not take account of your objectives, or your financial situation. We aim to bring you long-term focused analysis driven by fundamental data. Note that our analysis may not factor in the latest price-sensitive company announcements or qualitative material. Simply Wall St has no position in any stocks mentioned.