

A Look At Williams Sonoma (WSM) Valuation After Earnings Beat And Steady Full Year Guidance
Williams-Sonoma WSM | 0.00 |
Williams-Sonoma (WSM) is back in focus after its latest quarterly report topped analyst expectations on revenue growth and profitability, while management kept full year guidance unchanged, a mix many investors watch closely.
The latest earnings and guidance update has coincided with a sharp pickup in momentum, with a 7 day share price return of 15.5% and a 1 day gain of 3.1% taking Williams-Sonoma to US$198.38. This is the case even though the 90 day share price return is still down 5.2%, while the 3 year total shareholder return is very large at more than 7x.
If this kind of move has you thinking about what else is moving, it could be a good moment to broaden your search with 20 top founder-led companies
With Williams-Sonoma’s shares rebounding, trading just below analyst targets and with an indicated intrinsic discount, the key question now is simple: is the stock still undervalued, or is the market already pricing in future growth?
Most Popular Narrative: 20% Undervalued
With Williams-Sonoma closing at $198.38 versus a narrative fair value of about $198.74, the most followed view still sees an attractive discount once future cash flows are factored in.
Continued investment and advances in AI-powered tools and digital platforms are driving higher conversion rates, improved customer experience, and measurable productivity gains, supporting both revenue growth and expanded operating leverage at the margin level.
Curious what kind of revenue path and margin profile sit behind that fair value, and how much weight is placed on share count trends and future earnings multiples?
Result: Fair Value of $198.74 (UNDERVALUED)
However, this upbeat narrative can quickly be challenged if tariff volatility lifts input costs, or if weaker housing and discretionary spending weighs on big-ticket home categories.
Another Angle on Valuation
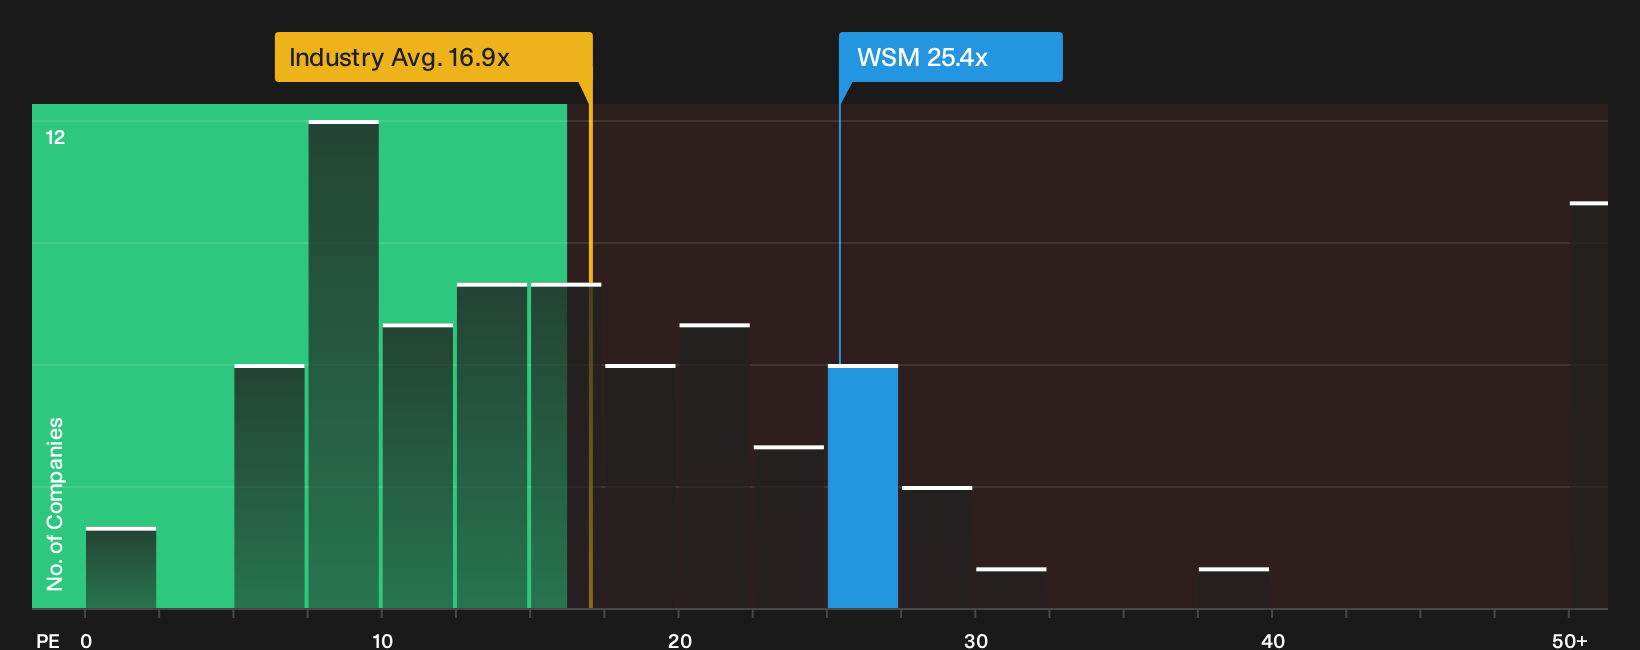
While the narrative fair value points to an undervalued stock, the current P/E of 21.5x looks expensive against both peers at 17.2x and a fair ratio of 17.4x. That gap suggests less room for error. Which signal do you trust more at this price?
Next Steps
If the mix of optimism and caution here feels familiar, take a closer look at the numbers yourself, form a quick view, then weigh that against the 3 key rewards
Looking for more investment ideas?
Do not stop with a single stock; use the screener to quickly spot fresh opportunities that match your style before the market focus shifts somewhere else.
- Target dependable growth and value by scanning a curated list of companies trading below estimated worth using the 46 high quality undervalued stocks.
- Prioritise resilience by focusing on businesses with strong finances through the solid balance sheet and fundamentals stocks screener (46 results).
- Spot early opportunities before they are widely followed by checking the screener containing 22 high quality undiscovered gems.
This article by Simply Wall St is general in nature. We provide commentary based on historical data and analyst forecasts only using an unbiased methodology and our articles are not intended to be financial advice. It does not constitute a recommendation to buy or sell any stock, and does not take account of your objectives, or your financial situation. We aim to bring you long-term focused analysis driven by fundamental data. Note that our analysis may not factor in the latest price-sensitive company announcements or qualitative material. Simply Wall St has no position in any stocks mentioned.