A Look At Workday (WDAY) Valuation After CA$1b AI Expansion Plan In Canada
Workday, Inc. Class A WDAY | 132.26 | +2.49% |
Workday’s Canadian expansion and what it could mean for WDAY stock
Workday (WDAY) has put a CA$1b commitment on the table in Canada over five years, targeting AI related development, local tech talent, and customer support, a move that naturally has investors reassessing the stock.
Despite the Canada commitment and a recent Workday Partner integration with Joveo, the stock has come under pressure, with a 30 day share price return of 19.5% decline and a 1 year total shareholder return of 32.8% decline. This suggests sentiment has cooled even as AI and cloud HR themes stay in focus.
If Workday’s recent moves around AI and talent are on your radar, it might also be a good moment to scan high growth tech and AI stocks for other potential ideas in the space.
With Workday trading around US$174.66, carrying an indicated 49.9% intrinsic discount and a 55.8% gap to the average analyst target, investors now face a simple question: is this a reset that creates opportunity, or is the market correctly discounting future growth?
Most Popular Narrative: 35.8% Undervalued
Workday’s most followed narrative pegs fair value around $272, well above the last close at $174.66. This puts its long term AI and cloud story in sharp focus.
Broad adoption of Workday's AI-enabled HR and finance products (with >70% of customers using Workday Illuminate and >75% of net new deals including at least one AI product), along with acquisitions like Paradox and Flowise, is fueling cross-sell/upsell activity, increasing average contract values and supporting future topline growth.
For readers interested in the revenue path, margin build and earnings power that adoption is being tied to, and how that feeds into the $272 fair value story, the full narrative lays out the assumptions in detail without requiring you to crunch the model yourself.
Result: Fair Value of $272.09 (UNDERVALUED)
However, there are still real risks, including tougher AI competition eroding pricing power and higher compliance costs in regulated sectors that could pressure margins if spending does not translate into efficiency.
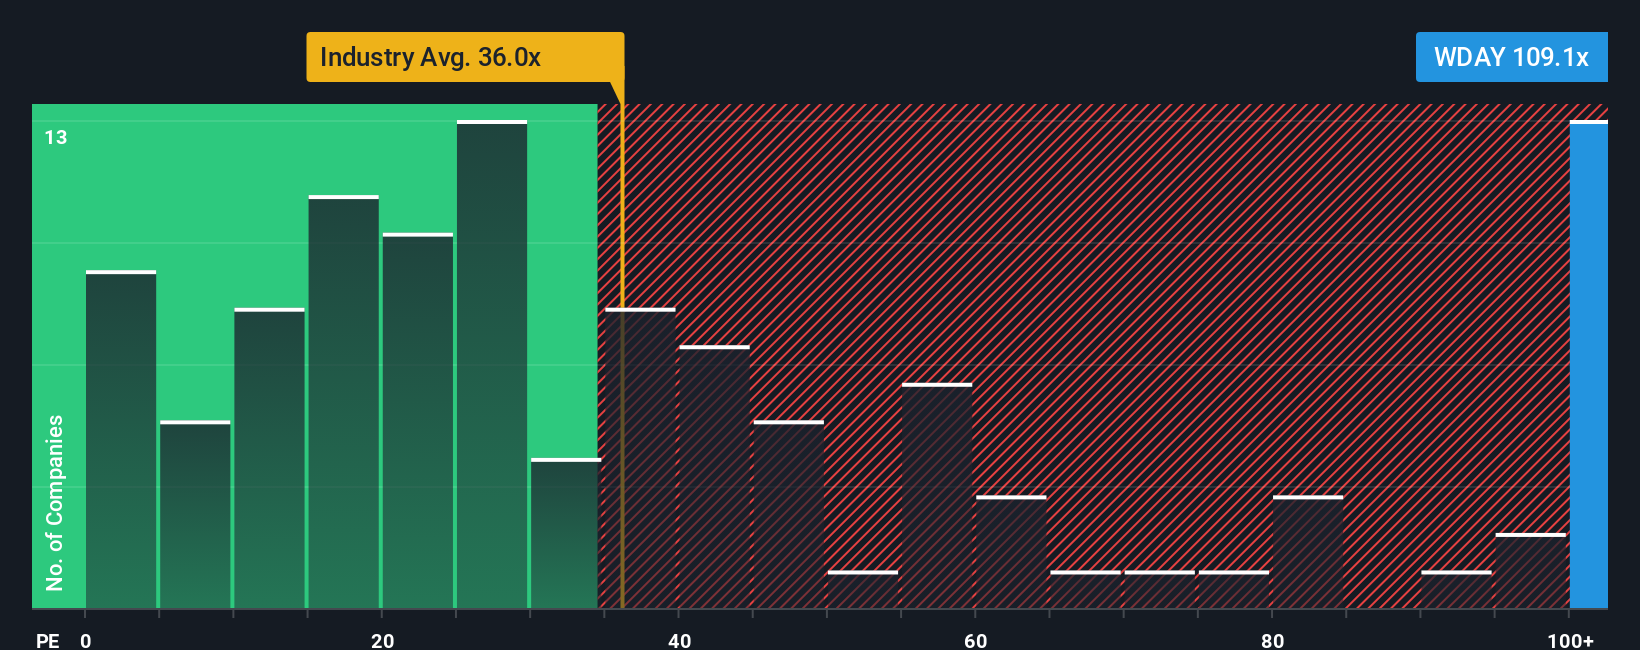
Another View: Multiples Paint A Tougher Picture
While our model suggests Workday trades at roughly a 49.9% discount to fair value, the P/E ratio tells a very different story. At 71.6x earnings versus a fair ratio of 46.6x, and compared with 28.8x for the US Software industry and 33.5x for peers, the stock screens as expensive. For you as an investor, that gap can either signal mispricing the model might be catching, or a warning that expectations are running hot. The key question is which signal you choose to put more weight on.
Build Your Own Workday Narrative
If you see the numbers differently, or prefer to test your own assumptions against the same data set, you can create a custom view in minutes, Do it your way.
A great starting point for your Workday research is our analysis highlighting 3 key rewards and 2 important warning signs that could impact your investment decision.
Looking for more investment ideas?
If Workday has sparked your interest, do not stop there. Cast a wider net with curated ideas that can help you stress test and broaden your portfolio thinking.
- Spot potential growth surprises early by scanning these 3526 penny stocks with strong financials that pair smaller market caps with financial strength checks.
- Target the front line of AI adoption by reviewing these 23 AI penny stocks that align advanced technology themes with tangible business models.
- Hunt for pricing gaps with these 865 undervalued stocks based on cash flows that highlight companies where current prices sit below cash flow based estimates.
This article by Simply Wall St is general in nature. We provide commentary based on historical data and analyst forecasts only using an unbiased methodology and our articles are not intended to be financial advice. It does not constitute a recommendation to buy or sell any stock, and does not take account of your objectives, or your financial situation. We aim to bring you long-term focused analysis driven by fundamental data. Note that our analysis may not factor in the latest price-sensitive company announcements or qualitative material. Simply Wall St has no position in any stocks mentioned.