ACADIA Pharmaceuticals Surges 53% as New Product Launches Fuel Fresh Valuation Debate
ACADIA Pharmaceuticals Inc. ACAD | 22.26 | +5.65% |
- Wondering if ACADIA Pharmaceuticals is actually good value right now? You’re not alone, and we’re going to dig into what the numbers really show.
- The stock has jumped 3.1% in the past week and is up a striking 53.3% over the last year, putting growth potential and risk back in the spotlight for current and prospective investors.
- There has been a flurry of activity around ACADIA lately, with new product launch updates and expanded regulatory approvals giving investors more to think about. These moves are shifting both the headlines and the way the market sees ACADIA’s growth outlook.
- On our valuation checks, ACADIA scores a 5 out of 6 for being undervalued. This number stands out in this sector. We will break down exactly what that means using standard approaches and, at the end, show you a smarter angle to understanding real value.
Approach 1: ACADIA Pharmaceuticals Discounted Cash Flow (DCF) Analysis
The Discounted Cash Flow (DCF) model is a classic method for estimating a company’s intrinsic value. It takes all expected future cash flows and discounts them back to today’s dollars to reflect what those future streams of income are worth right now.
For ACADIA Pharmaceuticals, the latest data puts its Free Cash Flow at $130 million. According to analyst forecasts, this figure is expected to grow substantially, with projections reaching approximately $650 million by 2029. Beyond the next five years, forecasts rely on extrapolation, and the growth outlook continues, with projected Free Cash Flow climbing to nearly $1.34 billion by 2035.
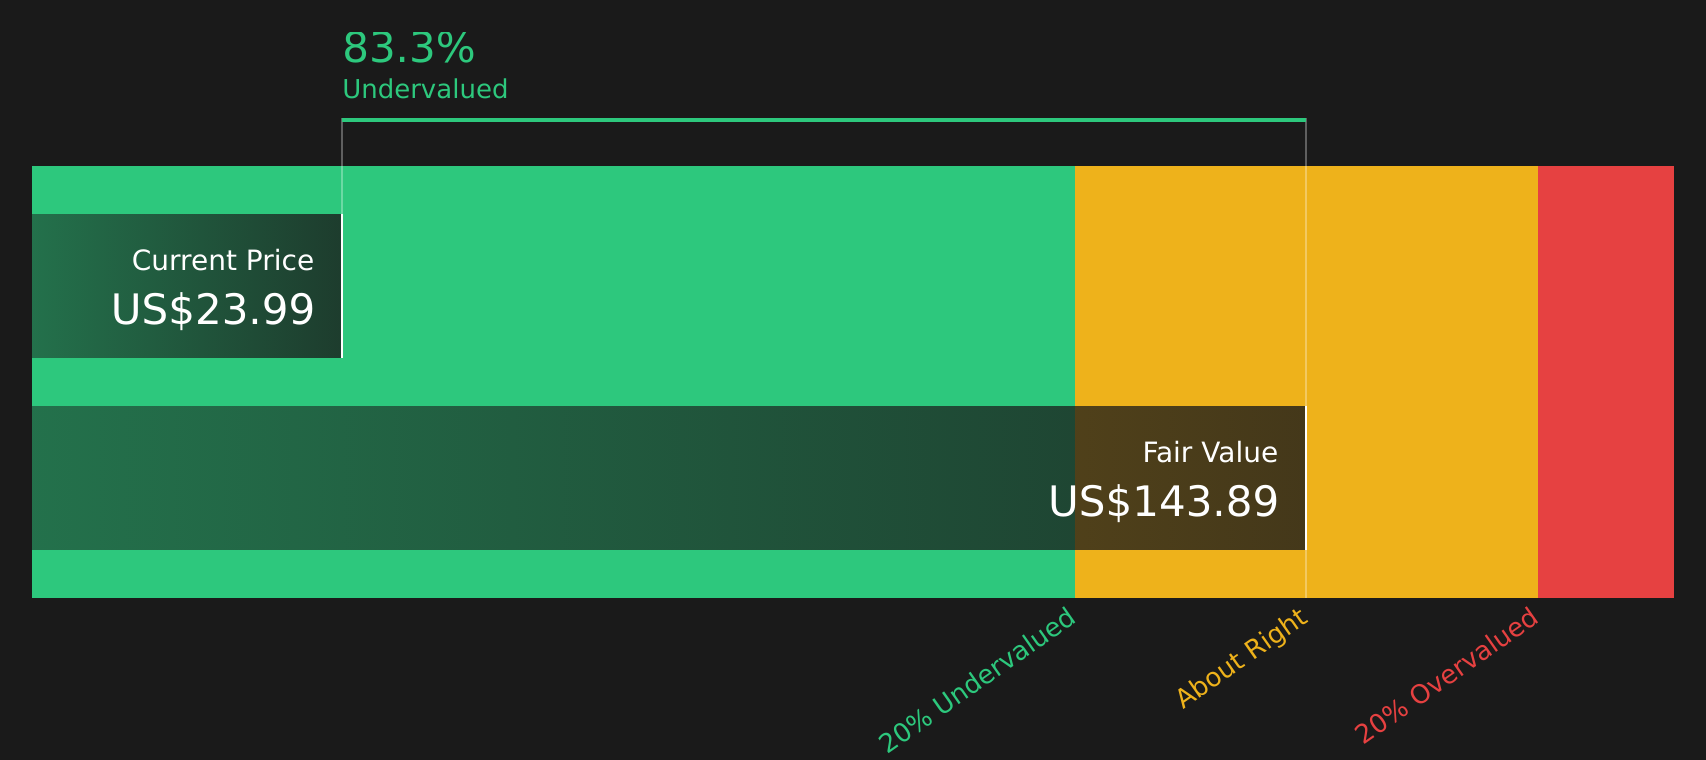
Based on DCF calculations, the intrinsic value of ACADIA is estimated to be $139.87 per share. This represents an 83.8% discount to the stock’s current trading price, suggesting the shares are significantly undervalued according to this model.
In summary, DCF analysis indicates that ACADIA Pharmaceuticals may be trading below its forecasted long-term value based on current projections.
Result: UNDERVALUED
Our Discounted Cash Flow (DCF) analysis suggests ACADIA Pharmaceuticals is undervalued by 83.8%. Track this in your watchlist or portfolio, or discover 832 more undervalued stocks based on cash flows.
Approach 2: ACADIA Pharmaceuticals Price vs Earnings
The Price-to-Earnings (PE) ratio is a particularly useful metric for evaluating profitable companies like ACADIA Pharmaceuticals because it directly links the company’s market value with its actual earnings. Investors often favor the PE ratio as it provides a clear, comparative measure of how much they are paying for every dollar of the company’s earnings.
However, it is important to note that growth expectations and risk factors can significantly influence what constitutes a “normal” PE ratio. Rapidly growing companies or those with lower risks generally command higher PE multiples, while slower growth or riskier profiles tend to trade at lower ratios.
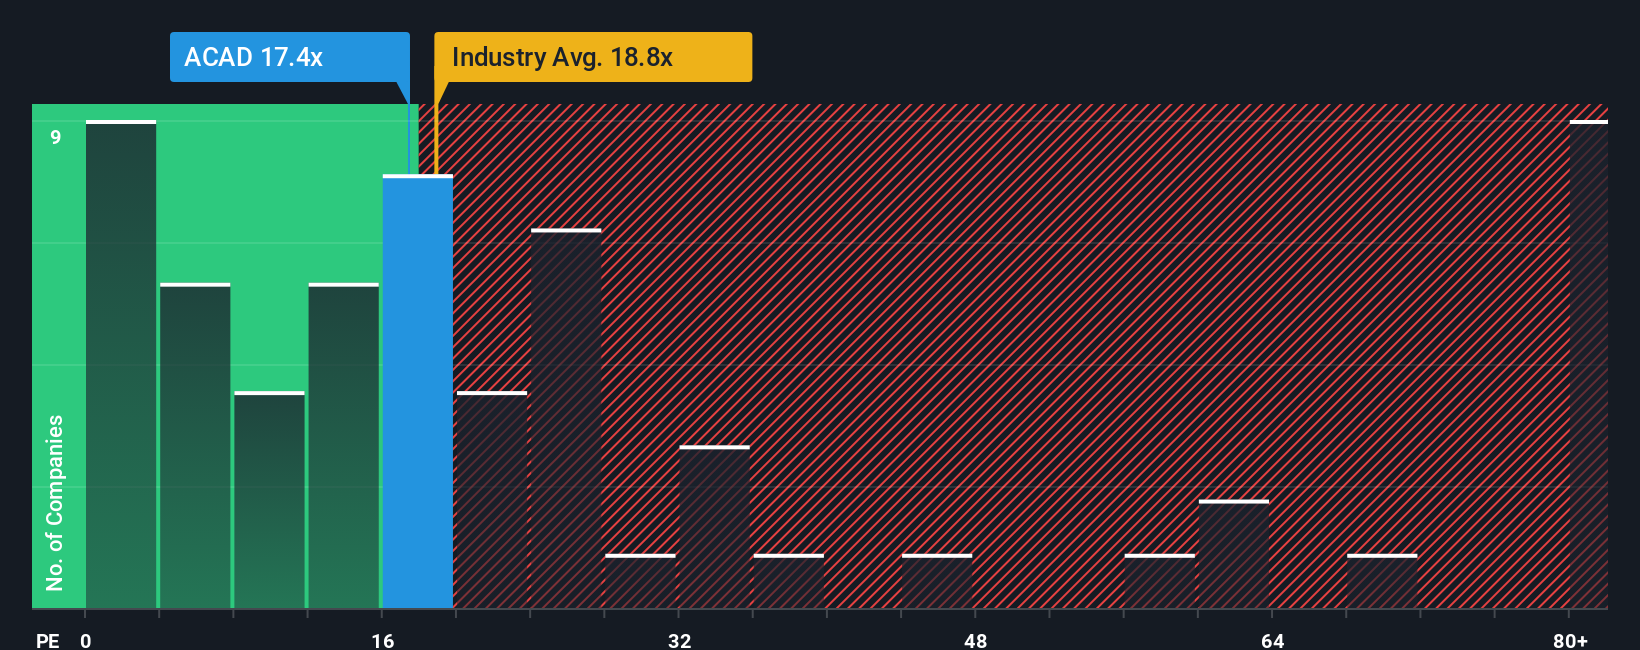
Currently, ACADIA Pharmaceuticals has a PE ratio of 17.24x. This is in line with the Biotechs industry average of 17.68x but well below the peer group average of 53.05x. Looking beyond these basic benchmarks, Simply Wall St’s proprietary Fair Ratio for ACADIA is 22.16x. This incorporates the company’s earnings growth outlook, risk profile, profit margins, industry landscape, and overall market capitalization.
The Fair Ratio is considered a superior benchmark because it adjusts for company-specific strengths and risks, allowing for a more comprehensive view of valuation than simple peer or industry comparisons. Since ACADIA’s actual PE is lower than its Fair Ratio, this may indicate that the stock is not fully pricing in its inherent advantages and growth prospects.
Result: UNDERVALUED
PE ratios tell one story, but what if the real opportunity lies elsewhere? Discover 1410 companies where insiders are betting big on explosive growth.
Upgrade Your Decision Making: Choose your ACADIA Pharmaceuticals Narrative
Earlier we mentioned that there is an even better way to understand valuation, so let's introduce you to Narratives. Narratives are more than just numbers; they're a way for investors to frame their own story and expectations about a company by attaching their revenue, margin, and fair value forecasts to specific business drivers and industry outlooks.
On Simply Wall St’s platform, Narratives connect a company’s unique backstory, news flow, and real-world developments with a targeted financial forecast and a calculated fair value. This means you can visualize and track how your own (or the community's) assumptions stack up against the current share price, making it easier to decide if, and when, you should buy or sell.
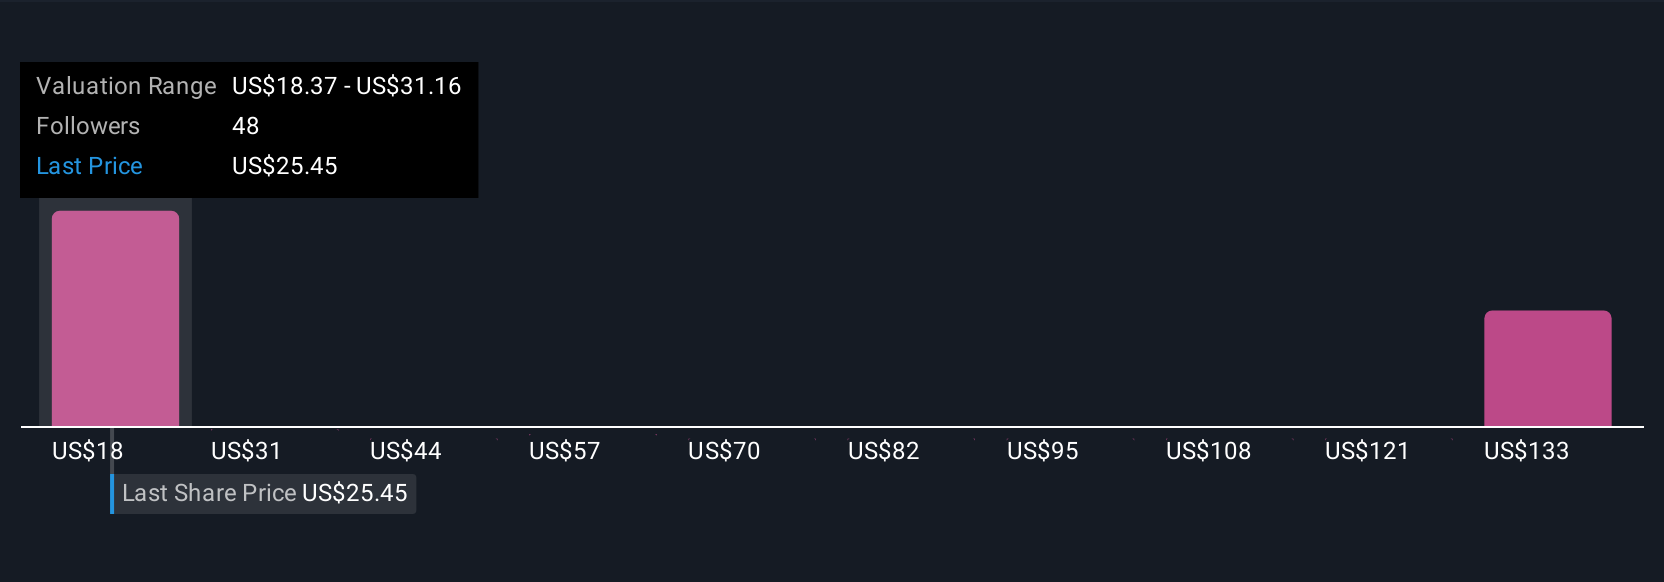
Narratives are completely accessible within our Community page and update dynamically whenever new news or earnings reports are released, allowing your view of ACADIA Pharmaceuticals to stay relevant as facts change. For example, some investors interpret ACADIA’s pipeline and regulatory wins to forecast bullish earnings and a fair value as high as $40, while others see more risk and maintain a fair value closer to $17. Narratives capture both perspectives, letting you align analysis with your outlook.
Do you think there's more to the story for ACADIA Pharmaceuticals? Head over to our Community to see what others are saying!
This article by Simply Wall St is general in nature. We provide commentary based on historical data and analyst forecasts only using an unbiased methodology and our articles are not intended to be financial advice. It does not constitute a recommendation to buy or sell any stock, and does not take account of your objectives, or your financial situation. We aim to bring you long-term focused analysis driven by fundamental data. Note that our analysis may not factor in the latest price-sensitive company announcements or qualitative material. Simply Wall St has no position in any stocks mentioned.