AerCap Holdings (AER) Earnings Contraction Forecast Tests 44% Net Margin Narrative
AerCap Holdings NV AER | 148.31 | +0.73% |
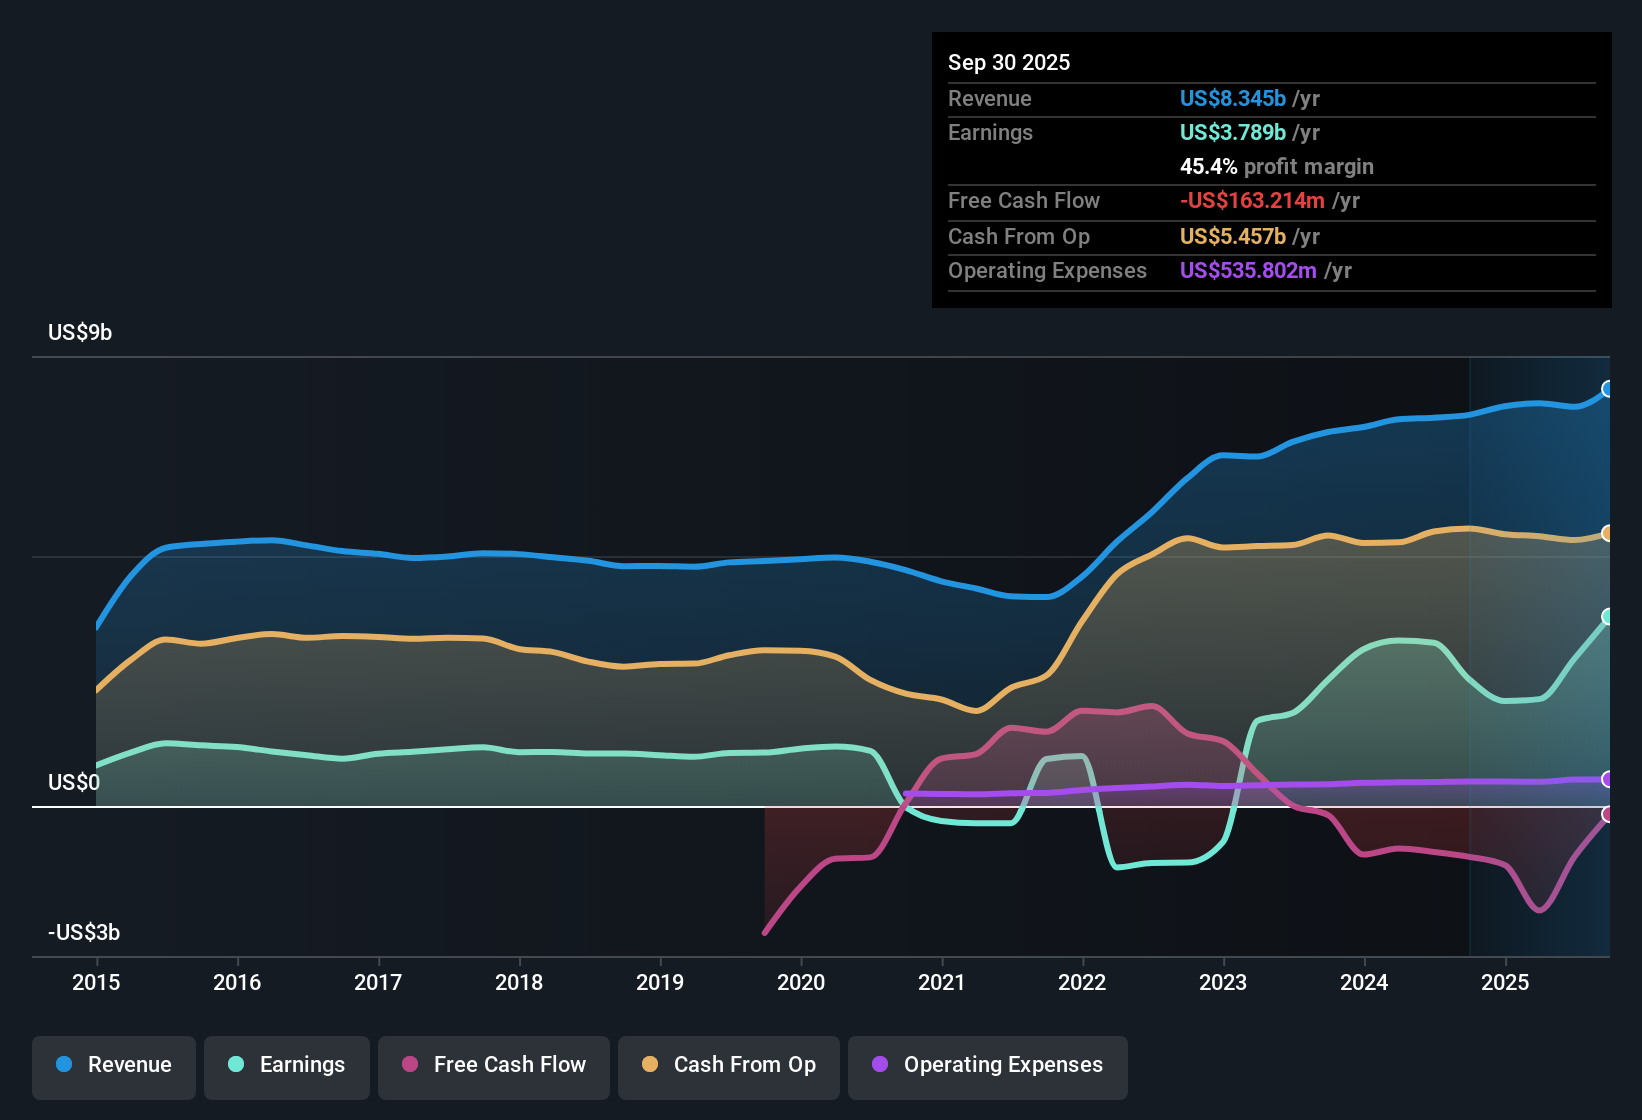
AerCap Holdings (NYSE:AER) rounded out FY 2025 with Q4 revenue of US$2.2 billion and basic EPS of US$3.86, capping a year in which trailing twelve month revenue reached US$8.5 billion and EPS came in at US$21.78 on a trailing basis. The company has seen quarterly revenue move from US$2.1 billion in Q4 2024 to US$2.2 billion in Q4 2025, while basic EPS shifted from US$3.66 to US$3.86 over the same period. This sets up the latest release as a check-in on how sustainably AerCap is turning its top line into profit. With a trailing net margin profile that sits against a backdrop of reported earnings growth and expanded profitability, investors are likely to focus on how durable these margins look after this update.
See our full analysis for AerCap Holdings.With the headline numbers on the table, the next step is to see how this earnings print lines up against the prevailing AerCap narratives, highlighting where the story gains support and where expectations may need a reset.
44% net margin on US$8.5b of revenue
- Over the last 12 months, AerCap generated US$8.5b of revenue and US$3.8b of net income, which works out to a 44% net margin versus 26.2% a year earlier according to the analysis data.
- What stands out for a bullish view is how that margin profile lines up with earnings growth of 78.7% year on year, yet Q4 net income of US$632.8 million was below Q3 and Q2 levels. This may prompt bulls to ask how repeatable the recent margin strength is when quarterly profit bounces around inside the year.
TTM EPS above US$21 alongside 6.2x P/E
- Trailing twelve month EPS sits at US$21.78, and with the current share price at US$140.07, that equates to a P/E of 6.2x, compared with 19.3x for the US market, 23.7x for the US Trade Distributors industry and 28.8x for peers.
- What is surprising for the bullish angle is that this low P/E sits next to multi year earnings growth that averages 48.1% per year and trailing growth of 78.7%. Yet the data also flags a DCF fair value of US$111.10, which is below the current price, so investors who like the earnings track record still have to weigh the trailing discount against that lower modelled value.
Forecast 22.7% annual earnings contraction and weak interest cover
- Forward looking data points to earnings declining by an average of 22.7% per year over the next three years, with revenue growth of 0.3% per year versus 10.2% for the broader US market, and interest payments are flagged as not well covered by earnings.
- Bears highlight this combination of projected earnings contraction and weak interest coverage as a key risk, and the contrast between that outlook and the current 44% trailing net margin and 78.7% earnings growth means anyone worried about leverage and future profitability can use those figures to argue that today’s strong snapshot may not fully reflect how sensitive the business could be to slower growth and financing costs.
Next Steps
Don't just look at this quarter; the real story is in the long-term trend. We've done an in-depth analysis on AerCap Holdings's growth and its valuation to see if today's price is a bargain. Add the company to your watchlist or portfolio now so you don't miss the next big move.
See What Else Is Out There
AerCap pairs a low 6.2x P/E with forecast 22.7% annual earnings contraction and weak interest cover, which may leave you uneasy about balance sheet resilience.
If those debt and earnings concerns are sticking in your mind, now is a smart time to check our solid balance sheet and fundamentals stocks screener (45 results) and hunt for companies built to handle tougher conditions.
This article by Simply Wall St is general in nature. We provide commentary based on historical data and analyst forecasts only using an unbiased methodology and our articles are not intended to be financial advice. It does not constitute a recommendation to buy or sell any stock, and does not take account of your objectives, or your financial situation. We aim to bring you long-term focused analysis driven by fundamental data. Note that our analysis may not factor in the latest price-sensitive company announcements or qualitative material. Simply Wall St has no position in any stocks mentioned.