AGCO (AGCO) One Off Gain Driven Profit Return Challenges Earnings Quality Narratives
AGCO Corporation AGCO | 114.59 | -2.68% |
AGCO (AGCO) has just wrapped up FY 2025 with fourth quarter revenue of US$2,920.2 million and basic EPS of US$1.29, alongside net income excluding extra items of US$95.5 million. This puts fresh numbers against a share price of US$132.57. Over the past six quarters, revenue has ranged from US$2,050.5 million to US$2,920.2 million, while basic EPS has moved between a loss of US$3.43 and a high of US$4.22. Over the same period, net income excluding extra items has swung from a loss of US$255.7 million to a profit of US$314.8 million, framing a story where profitability and margins are firmly in focus for investors reading this result.
See our full analysis for AGCO.With the headline numbers on the table, the next step is to see how this earnings profile lines up against the widely followed narratives around AGCO’s growth, risks, and profitability story.
Trailing P/E Sits At 13.6x Versus 27.9x Industry
- AGCO is on a trailing P/E of 13.6x compared with a US Machinery industry average of 27.9x and a peer group at 24.2x, while the shares trade at US$132.57 against a DCF fair value of US$175.36 and an analyst price target of US$127.29.
- Bulls often point to this kind of discount as a value angle, and the numbers here give them some support but also a reality check.
- The DCF fair value of US$175.36 and the 24.4% gap to the current US$132.57 price line up with the bullish idea that the stock is priced below intrinsic value.
- At the same time, the 13.6x P/E sits alongside five year earnings that declined 17.5% per year, which directly questions a simple bullish claim that the current multiple alone tells the whole story.
Curious how a 13.6x P/E and a DCF fair value above today’s price feed into the longer term story for AGCO? Curious how numbers become stories that shape markets? Explore Community Narratives
Return To Profit, But Helped By US$148.9m One Off
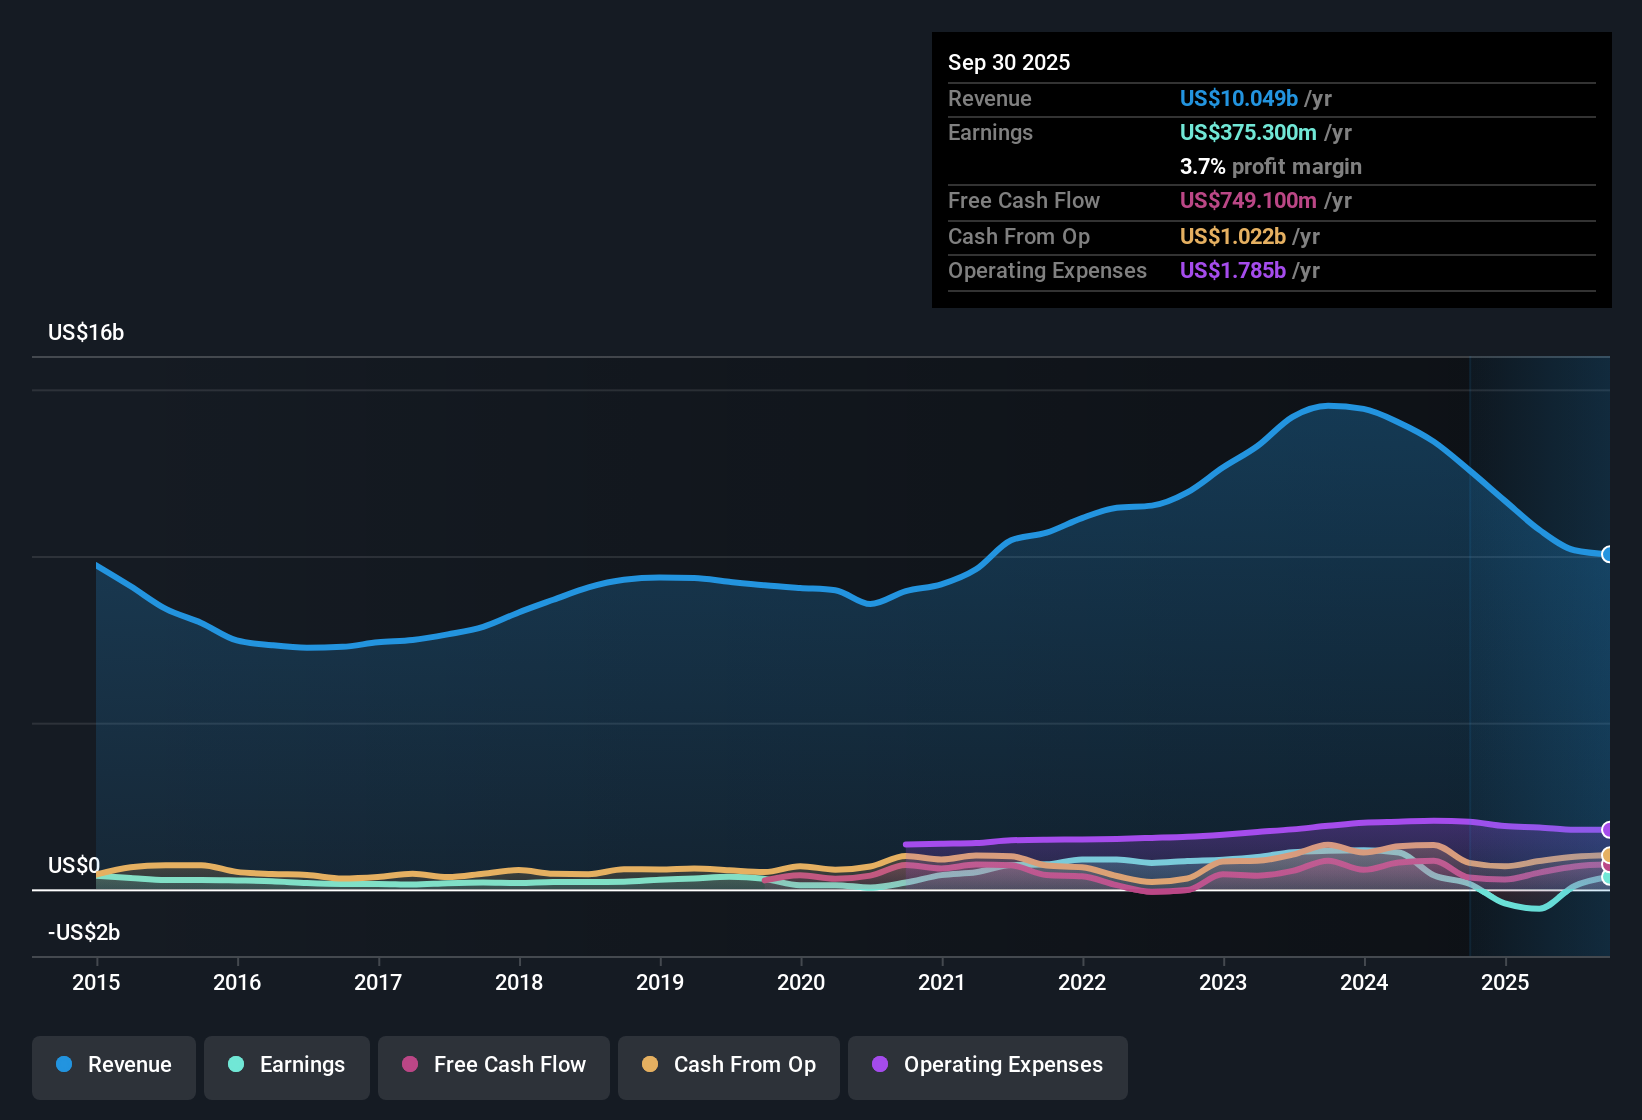
- Over the last 12 months AGCO recorded US$726.5 million of net income excluding extra items on US$10.1b of revenue, and those figures were materially influenced by a one off gain of US$148.9 million.
- Bears highlight that the recent profitability can look cleaner than it is, and the data here gives that cautious view some grounding.
- Five year earnings declined 17.5% per year even though the latest trailing period shows profit of US$726.5 million, so the improvement is not a simple straight line.
- The US$148.9 million non recurring gain sits inside that profit number, which makes it harder for a bearish critic to ignore when they argue that current earnings may not fully reflect the underlying run rate.
Revenue Growth At 5.9% Versus US Market 10.2%
- Revenue growth of 5.9% per year in the recent data trails the US market’s 10.2% per year, while earnings are forecast in this dataset to grow about 8.5% annually, which is below the cited 15.6% growth forecast for the broader US market.
- Supporters who frame AGCO as a solid long term grower get a mixed message from these figures rather than a clean win.
- The move back into profit over the last year and trailing EPS of US$9.76 show AGCO generating earnings, which lines up with a bullish view that the business can support growth from a profitable base.
- On the other hand, revenue and earnings growth rates that sit below the market and five year earnings declining 17.5% per year both limit how far a bullish growth story can run purely off these numbers.
Next Steps
Don't just look at this quarter; the real story is in the long-term trend. We've done an in-depth analysis on AGCO's growth and its valuation to see if today's price is a bargain. Add the company to your watchlist or portfolio now so you don't miss the next big move.
See What Else Is Out There
AGCO’s slower 5.9% revenue growth versus the US market, five year earnings decline, and reliance on a US$148.9 million one off gain all point to weaker underlying momentum.
If those patchy trends make you cautious, it is worth checking our 53 high quality undervalued stocks to find companies where growth, earnings quality, and pricing look more compelling right now.
This article by Simply Wall St is general in nature. We provide commentary based on historical data and analyst forecasts only using an unbiased methodology and our articles are not intended to be financial advice. It does not constitute a recommendation to buy or sell any stock, and does not take account of your objectives, or your financial situation. We aim to bring you long-term focused analysis driven by fundamental data. Note that our analysis may not factor in the latest price-sensitive company announcements or qualitative material. Simply Wall St has no position in any stocks mentioned.